Alex’s Adventures in Numberland (64 page)
Read Alex’s Adventures in Numberland Online
Authors: Alex Bellos

Quételet’s ideas transformed the use of the word
statistics
, whose original meaning had little to do with numbers. The word was used to describe general facts about the state; as in the type of information required by statesmen. Quételet turned statistics into a much wider discipline, one that was less about statecraft and more about the mathematics of collective behaviour. He could not have done this without advances in probability theory, which provided techniques to analyse the randomness in data. In Brussels in 1853 Quételet hosted the first international conference on statistics.
Quételet’s insights on collective behaviour reverberated in other sciences. If by looking at data from human populations you could detect reliable patterns, then it was only a small leap to realize that populations of, for example, atoms also behaved with predictable regularities. James Clerk Maxwell and Ludwig Boltzmann were indebted to Quételet’s statistical thinking when they came up with the kinetic theory of gases, which explains that the pressure of a gas is determined by the collisions of its molecules travelling randomly at different velocities. Though the velocity of any individual molecule cannot be known, the molecules overall behave in a predictable way. The origin of the kinetic theory of gases is an interesting exception to the general rule that developments in the social sciences are the result of advances in the natural sciences. In this case, knowledge flowed in the other direction.
The most common pattern that Quételet found in all of his research was the bell curve. It was ubiquitous when studying data about human populations. Sets of data in those days were harder to come by than they are now, so Quételet scoured the world for them with the doggedness of a professional collector. For example, he came across a study published in the 1814
Edinburgh Medical Journal
containing chest measurements of 5738 Scottish soldiers. Quételet drew up a graph of the numbers and showed that the distribution of chest sizes traced a bell curve with a mean of about 40 inches. From other sets of data he showed that the heights of men and women also plot a bell curve. To this day, the retail industry relies on Quételet’s discoveries. The reason why clothes shops stock more mediums than they do smalls and larges is because the distribution of human sizes corresponds roughly to the bell curve. The most recent data on the shoe sizes of British adults, for example, throws up a very familiar shape:
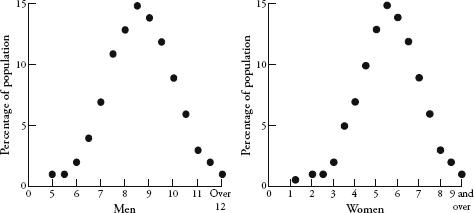
British shoe sizes.
Quételet died in 1874. A decade later, this side of the Channel, a 60-year-old man with a bald pate and fine Victorian whiskers could frequently be seen on the streets of Britain gawping at women and rummaging around in his pocket. This was Francis Galton, the eminent scientist, conducting fieldwork. He was measuring female attractiveness. In order to discreetly register his opinion on passing women he would prick a needle in his pocket into a cross-shaped piece of paper, to indicate whether she was ‘attractive’, ‘indifferent’ or ‘repellent’. After completing his survey he compiled a map of the country based on looks. The highest-rated city was London and the lowest-rated was Aberdeen.
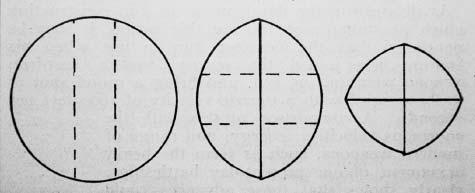
In ‘Cutting a Round Cake on Scientific Principles’ Galton marked intended cuts as broken straight lines, and cuts as solid lines. This method minimizes exposing the insides of the cake to become dry, which would happen if one cuts a slice in the traditional (and, he concludes, ‘very faulty’) way. In the second and third stages the cake is to be held together with an elastic band.
Galton was probably the only man in nineteenth-century Europe who was even more obsessed with gathering data than Quételet was. As a young scientist, Galton took the temperature of his daily pot of tea, together with such information as the volume of boiling water used and how delicious it tasted. His aim was to establish how to make the perfect cuppa. (He reached no conclusions.) In fact, an interest in the mathematics of afternoon tea was a lifelong passion. When he was an old man he sent the diagram above to the journal
Nature
, which shows his suggestion of the best way to cut a tea-cake in order to keep it as fresh as possible.
Oh, and since this is a book with the word ‘number’ in its title, it would be unsporting for me at this juncture not to mention Galton’s ‘number forms’ – even if they have little to do with the subject of this chapter. Galton was fascinated that a substantial number of people – he estimated 5 percent – automatically and involuntarily envisaged numbers as mental maps. He coined the term
number form
to describe these maps, and wrote that they have a ‘precisely defined and constant position’ and are such that individuals cannot think of a number ‘without referring to its own particular habitat in their mental field of view’. What is especially interesting about number forms is that they generally show up very peculiar patterns. Instead of a straight line, which might be expected, they often involve rather peculiar twists and turns.
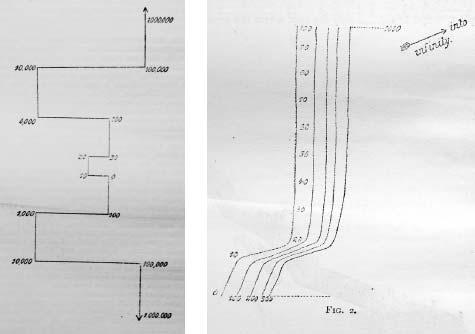
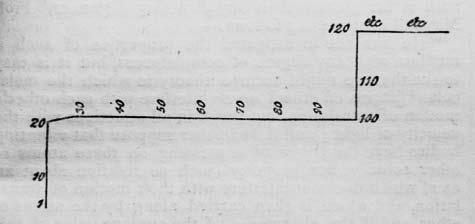
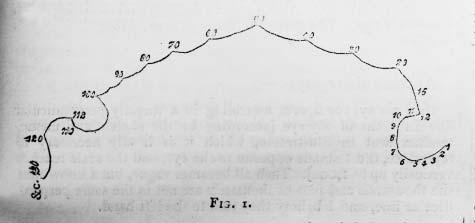
Four examples of Galton’s ‘number forms’: curious spatial representations of numbers.
Number forms have the whiff of Victorian freakishness, perhaps evidence of repressed emotions or overindulgence in opiates. Yet a century later they are researched in academia, recognized as a type of synaesthesia, which is the neurological phenomenon that occurs when stimulation of one cognitive pathway leads to involuntary stimulation in another. In this case, numbers are given a location in space. Other types of synaesthesia include believing letters have colours, or that days of the week have personalities. Galton, in fact, underestimated the presence of number forms in humans. It is now thought that 12 percent of us experience them in some way.
But Galton’s principal passion was measuring. He built an ‘anthropometric laboratory’ – a drop-in centre in London, where members of the public could come to have their height, weight, strength of grip, swiftness of blow, eyesight and other physical attributes measured by him. The lab compiled details on more than 10,000 people, and Galton achieved such fame that Prime Minister William Gladstone even popped by to have his head measured. (‘It was a beautifully shaped head, though low,’ Galton said.) In fact, Galton was such a compulsive measurer that even when he had up very ng obvious to measure he would find something to satisfy his craving. In an article in
Nature
in 1885 he wrote that while present at a tedious meeting he had begun to measure the frequency of fidgets made by his colleagues. He suggested that scientists should henceforth take advantage of boring meetings so that ‘they may acquire the new art of giving numerical expression to the amount of boredom expressed by [an] audience’.
Galton’s research corroborated Quételet’s in that it showed that the variation in human populations was rigidly determined. He too saw the bell curve everywhere. In fact, the frequency of the appearance of the bell curve led Galton to pioneer the word ‘normal’ as the appropriate name for the distribution. The circumference of a human head and the size of the brain all produced bell curves, though Galton was especially interested in non-physical attributes such as intelligence. IQ tests hadn’t been invented at the time, so Galton looked for other measures of intelligence. He found them in the results of the admission exams to the Royal Military Academy at Sandhurst. The exam scores, he discovered, also conformed to the bell curve. It filled him with a sense of awe. ‘I know of scarcely anything so apt to impress the imagination as the wonderful form of cosmic order expressed by the [bell curve],’ he wrote. ‘The law would have been personified by the Greeks and deified, if they had known of it. It reigns with serenity and in complete self-effacement amidst the wildest confusion. The huger the mob, and the greater the apparent anarchy, the more perfect is its sway. It is the supreme law of unreason.’
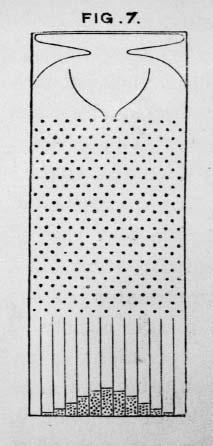
Galton invented a beautifully simple machine that explains the mathematics behind his cherished curve, and he called it the quincunx. The word’s original meaning is the pattern of five dots on a die, and the contraption is a type of pinball machine in which each horizontal line of pins is offset by half a position from the line above. A ball is dropped into the top of the quincunx, and then it bounces between the pins until it falls out the bottom into a rack of columns. After many balls have been dropped in, the shape they make in the columns where they have naturally fallen resembles a bell curve.
