Alex’s Adventures in Numberland (38 page)
Read Alex’s Adventures in Numberland Online
Authors: Alex Bellos

For any equation in
x
and
y
, the points where (
x,y
) has values for
x
and
y
that satisfy the equation describe a line on a graph. For example, the points (0,0), (1,1), (2,2) and (3,3) all satisfy our first equation above,
y
=
x
. If we mark, or plot, these points on a graph, it becomes clear that the equation
y
=
x
generates a straight line, as in the figure below. Likewise, we can draw the second equation,
y
= 3
x
– 2. By assigning
x
a value and then working out what
y
is, we can establish that the points (0,–2), (1,1), (2,4) and (3,7) are on the line described by this equation. It is also a straight line, which crosses the
y
-axis at –2, below right:
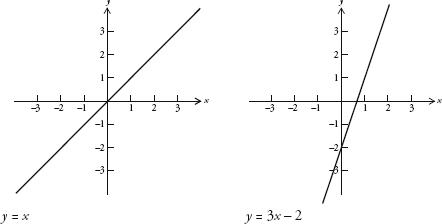
If we superimpose one of these lines over the other, we see that they cross at the point (1,1). So, we can see that the soluon of simultaneous equations is the coordinates of the point of intersection of the two lines described by those equations.
The idea that lines can represent equations was the major innovation of Descartes’
La Géométrie
. His ‘Cartesian’ coordinate system was revolutionary because it forged a thus-far uncharted path between algebra and geometry. For the first time, two separate and distinct areas of study were revealed not only to be linked but also to be alternate representations of each other. One of Descartes’ motivations was to make both algebra and geometry easier to understand because, as he said, independently ‘they extend to only very abstract matters which seem to be of no practical use, [geometry] is always so tied to the inspection of figures that it cannot exercise the understanding without greatly tiring the imagination, while…[algebra] is so subjected to certain rules and numbers that it has become a confused and obscure art which oppresses the mind instead of being a science which cultivates it’. Descartes was no fan of overexertion. He was one of history’s late risers, famously staying in bed until midday whenever he could.
The Cartesian marriage of algebra and geometry is a powerful example of the interplay between abstract ideas and spatial imagery, a recurring theme in mathematics. Many of the most impressive proofs in algebra – such as the proof of Fermat’s Last Theorem – rely on geometry. Likewise, now that they could be described algebraically, 2000-year-old geometrical problems were given a new lease of life. One of the most exciting characteristics of maths is how seemingly different topics are interrelated, and how this in itself leads to vibrant new discoveries.
In 1649 Descartes moved to Stockholm to be personal tutor to Queen Christina of Sweden. She was an early bird. Unaccustomed to both the Scandinavian winter and to waking up at 5 a.m., he caught pneumonia shortly after arriving and died.
One of the most obvious corollaries of Descartes’ insight that equations in
x
and
y
can be written as lines was the recognition that different types of equation produce different types of line. We can start classifying them here:
Equations such as
y
=
x
and
y
= 3
x
– 2, in which the only terms are
x
and
y
, always produce straight lines.
By contrast, equations with quadratic terms – ones that include values for
x
2
and/or
y
2
– always produce one of the following four types of curve: circle, ellipse, parabola or hyperbola.
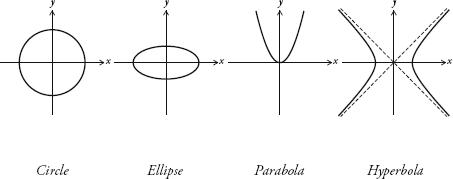
The fact that every circle, ellipse, parabola and hyperbola that can be drawn can be described by a quadratic equation in
x
s and
y
s is helpful for science because all these curves are found in the real world. The parabola is the shape that describes the trajectory of an object flying through the air (ignoring air resistance and assuming a uniform gravitational field). When a soccer player kicks a ball, for example, it traces a parabola. The ellipse is the curve that describes how planets orbit around the sun, and the path followed by the shadow of the tip of a sundial during a day is a hyperbola.
Consider the following quadratic equation, which is like a machine for drawing s and ellipses:
 , where
a
and
b
are constants
The machine has two knobs, one for
a
and one for
b
. By adjusting the values of
a
and
b
we can create any circle or ellipse with centre 0 that we want.
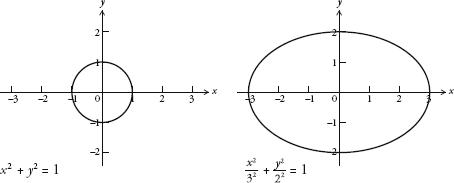
For example, when
a
is the same as
b
the equation is a circle with radius
a
. When
a
=
b
= 1, the equation is
x
2
+
y
2
= 1 and produces a circle with radius 1, also called the ‘unit circle’, as shown below left. And when
a
=
b
= 4, the equation is and this is the circle with radius 4. If, on the other hand,
a
and
b
are different numbers, then the equation is an ellipse that crosses the
x
-axis at
a
, and the
y
-axis at
b
. For example, the curve below right is the ellipse when
a
= 3 and
b
= 2.
In 1818 the French mathematician Gabriel Lamé started to play around with the formula for the circle and ellipse. He wondered what would happen if he started to tweak the exponent, or power, rather than the values of
a
and
b
.
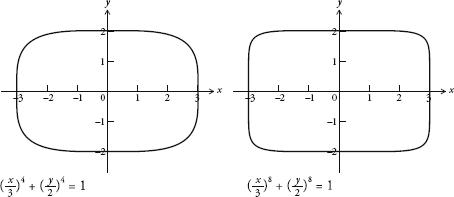
The effect of this adjustment was fascinating. For example, consider the equation
x
n
+
y
n
= 1. When
n
= 2, this creates the unit circle. Here are the curves produced by
n
= 2,
n
= 4 and
n
= 8:
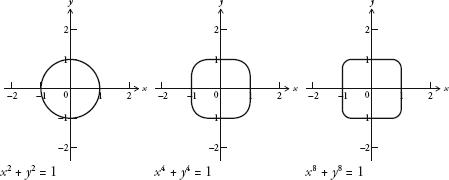
When
n
is 4, the curve looks like an aerial view of a Babybel cheese squashed in a box. Its sides have become flattened and there are four rounded corners. It’s as if the circle is trying to become a square. When
n
is 8, the curve is even more like a square.
In fact, the higher you push
n
, the closer the curve is to a square. In the limit, when
x
8
+
y
8
= 1, the equation
is
a square. (If anything deserves to be called the squaring of the circle, surely this is it.)
The same thing happens to an ellipse. If we take the ellipse described by ( )
n
+ ( )
n
= 1, then by increasing the values of
n
, the ellipse will eventually turn into a rectangle.
