Programming Python (72 page)

But enough about
the idiosyncrasies of Unicode text—let’s get back to
coding GUIs. Besides the position specification roles we’ve seen so far,
theTextwidget’s text tags can also
be used to apply formatting and behavior to all characters in a
substring and all substrings added to a tag. In fact, this is where much
of the power of theTextwidget
lies:
Tags have formatting attributes for setting color, font, tabs,
and line spacing and justification; to apply these to many parts of
the text at once, associate them with a tag and apply formatting to
the tag with thetag_configmethod, much like the generalconfigwidget we’ve been using.Tags can also have associated event bindings, which let you
implement things such as hyperlinks in aTextwidget: clicking the text triggers
its tag’s event handler. Tag bindings are set with
atag_bindmethod,
much like the general widgetbindmethod we’ve already met.
With tags, it’s possible to display multiple configurations within
the sameTextwidget; for instance,
you can apply one font to theTextwidget at large and other fonts to tagged text. In addition, theTextwidget allows you to embed other
widgets at an index (they are treated like a single character), as well
as images.
Example 9-12
illustrates the basics of all these advanced tools at once and draws the
interface captured in
Figure 9-22
. This
script applies formatting and event bindings to three tagged substrings,
displays text in two different font and color schemes, and embeds an
image and a button. Double-clicking any of the tagged substrings (or the
embedded button) with a mouse triggers an event that prints a “Got tag
event” message tostdout.
Example 9-12. PP4E\Gui\Tour\texttags.py
"demo advanced tag and text interfaces"
from tkinter import *
root = Tk()
def hello(event): print('Got tag event')
# make and config a Text
text = Text()
text.config(font=('courier', 15, 'normal'))                  # set font for all
text.config(width=20, height=12)
text.pack(expand=YES, fill=BOTH)
text.insert(END, 'This is\n\nthe meaning\n\nof life.\n\n')   # insert six lines
# embed windows and photos
btn = Button(text, text='Spam', command=lambda: hello(0))    # embed a button
btn.pack()
text.window_create(END, window=btn)                          # embed a photo
text.insert(END, '\n\n')
img = PhotoImage(file='../gifs/PythonPowered.gif')
text.image_create(END, image=img)
# apply tags to substrings
text.tag_add('demo', '1.5', '1.7')                       # tag 'is'
text.tag_add('demo', '3.0', '3.3')                       # tag 'the'
text.tag_add('demo', '5.3', '5.7')                       # tag 'life'
text.tag_config('demo', background='purple')             # change colors in tag
text.tag_config('demo', foreground='white')              # not called bg/fg here
text.tag_config('demo', font=('times', 16, 'underline')) # change font in tag
text.tag_bind('demo', '', hello)               # bind events in tag
root.mainloop()
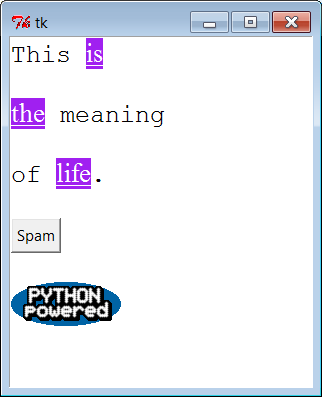
Figure 9-22. Text tags in action
Such embedding and tag tools could ultimately be used to render a
web page. In fact, Python’s standardhtml.parserHTML parser module can help
automate web page GUI construction. As you can probably tell, though,
theTextwidget offers more GUI
programming options than we have space to list here. For more details on
tag and text options, consult other Tk and tkinter references. Right
now, art class is about to
begin.
When it comes to graphics, the tkinterCanvaswidget
is the most free-form device in the library. It’s a place to
draw shapes, move objects dynamically, and place other kinds of widgets.
The canvas is based on a structured graphic object model: everything drawn
on a
canvas can be processed as an
object
.
You can get down to the pixel-by-pixel level in a canvas, but you can also
deal in terms of larger objects such as shapes, photos, and embedded
widgets. The net result makes the canvas powerful enough to support
everything
from simple paint
programs to full-scale visualization and animation.
Canvases are
ubiquitous in much nontrivial GUI work, and we’ll see
larger canvas examples show up later in this book under the names
PyDraw, PyPhoto, PyView,
PyClock
,
and PyTree. For now, let’s jump right into an example that illustrates
the basics.
Example 9-13
runs most of the major canvas drawing methods.
Example 9-13. PP4E\Gui\Tour\canvas1.py
"demo all basic canvas interfaces"
from tkinter import *
canvas = Canvas(width=525, height=300, bg='white')   # 0,0 is top left corner
canvas.pack(expand=YES, fill=BOTH)                   # increases down, right
canvas.create_line(100, 100, 200, 200)               # fromX, fromY, toX, toY
canvas.create_line(100, 200, 200, 300)               # draw shapes
for i in range(1, 20, 2):
canvas.create_line(0, i, 50, i)
canvas.create_oval(10, 10, 200, 200, width=2, fill='blue')
canvas.create_arc(200, 200, 300, 100)
canvas.create_rectangle(200, 200, 300, 300, width=5, fill='red')
canvas.create_line(0, 300, 150, 150, width=10, fill='green')
photo=PhotoImage(file='../gifs/ora-lp4e.gif')
canvas.create_image(325, 25, image=photo, anchor=NW)  # embed a photo
widget = Label(canvas, text='Spam', fg='white', bg='black')
widget.pack()
canvas.create_window(100, 100, window=widget)        # embed a widget
canvas.create_text(100, 280, text='Ham')             # draw some text
mainloop()
When run, this script draws the window captured in
Figure 9-23
. We saw how to place a
photo on canvas and size a canvas for a photo earlier on this tour (see
Images
). This script also draws shapes, text, and
even an embeddedLabelwidget. Its
window gets by on looks alone; in a moment, we’ll learn how to add event
callbacks that let users interact with drawn
items.
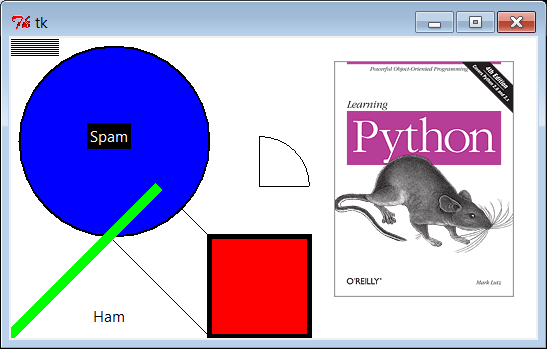
Figure 9-23. canvas1 hardcoded object sketches
Canvases are
easy to use, but they rely on a coordinate system, define
unique drawing methods, and name objects by identifier or tag. This
section introduces these core canvas concepts.
All items
drawn on a canvas are distinct objects, but they are not
really widgets. If you study thecanvas1script closely, you’ll notice that
canvases are created and packed (or gridded or placed) within their
parent container just like any other widget in tkinter. But the items
drawn on a canvas are not. Shapes, images, and so on, are positioned
and moved on the canvas by coordinates, identifiers, and tags. Of
these, coordinates are the most fundamental part of the canvas
model.
Canvases define an (X,Y) coordinate system for their drawing
area; x means the horizontal scale, y means vertical. By default,
coordinates are measured in screen pixels (dots), the upper-left
corner of the canvas has coordinates (0,0), and x and y coordinates
increase to the right and down, respectively. To draw and embed
objects within a canvas, you supply one or more (X,Y) coordinate pairs
to give absolute canvas locations. This is different from the
constraints we’ve used to pack widgets thus far, but it allows very
fine-grained control over graphical layouts, and it supports more
free-form interface techniques such as
animation.
[
35
]
The canvas
allows you to draw and display common shapes such as
lines, ovals, rectangles, arcs, and polygons. In addition, you can
embed text, images, and other kinds of tkinter widgets such as labels
and buttons. Thecanvas1script
demonstrates all the basic graphic object constructor calls; to each,
you pass one or more sets of (X,Y) coordinates to give the new
object’s location, start point and endpoint, or diagonally opposite
corners of a bounding box that encloses the shape:
id = canvas.create_line(fromX, fromY, toX, toY)       # line start, stop
id = canvas.create_oval(fromX, fromY, toX, toY)       # two opposite box corners
id = canvas.create_arc( fromX, fromY, toX, toY)       # two opposite oval corners
id = canvas.create_rectangle(fromX, fromY, toX, toY)  # two opposite corners
Other drawing calls specify just one (X,Y) pair, to give the
location of the object’s upper-left corner:
id = canvas.create_image(250, 0, image=photo, anchor=NW)  # embed a photo
id = canvas.create_window(100, 100, window=widget)        # embed a widget
id = canvas.create_text(100, 280, text='Ham')             # draw some text
The canvas also provides acreate_polygonmethod that accepts an arbitrary set of
coordinate
arguments defining the
endpoints of connected lines; it’s useful for drawing more arbitrary
kinds of shapes composed of straight lines.
In addition to coordinates, most of these drawing calls let you
specify common configuration options, such as outlinewidth,fillcolor,outlinecolor, and so on. Individual object
types have unique configuration options all their own, too; for
instance, lines may specify the shape of an optional arrow, and text,
widgets, and images may be anchored to a point of the compass (this
looks like the packer’sanchor, but
really it gives a point on the object that is positioned at the [X,Y]
coordinates given in thecreatecall;NWputs the upper-left corner
at [X,Y]).
Perhaps the most important thing to notice here, though, is that
tkinter does most of the “grunt” work for you—when drawing graphics,
you provide coordinates, and shapes are automatically plotted and
rendered in the pixel world. If you’ve ever done any lower-level
graphics work, you’ll appreciate the difference.
Although not used by thecanvas1script,
every object you put on a canvas has an identifier, returned by
thecreate_method that
draws or embeds the object (what was coded asidin the last section’s examples). This
identifier can later be passed to other methods that move the object
to new coordinates, set its configuration options, delete it from the
canvas, raise or lower it among other overlapping objects, and so
on.
For instance, the canvasmovemethod accepts both an object identifier and X and Y offsets (not
coordinates), and it moves the named object by the offsets
given:
canvas.move(objectIdOrTag, offsetX, offsetY) # move object(s) by offset
If this happens to move the object off-screen, it is simply
clipped (not shown). Other common canvas operations process objects,
too:
canvas.delete(objectIdOrTag)                   # delete object(s) from canvas
canvas.tkraise(objectIdOrTag)                  # raise object(s) to front
canvas.lower(objectIdOrTag)                    # lower object(s) below others
canvas.itemconfig(objectIdOrTag, fill='red')   # fill object(s) with red color
Notice thetkraisename—raiseby itself is a reserved
word in Python. Also note that theitemconfigmethod is
used to configure objects drawn on a canvas after they have been
created; useconfigto set
configuration options for the canvas itself. Probably the best thing
to notice here, though, is that because tkinter is based on structured
objects, you can process a graphic object all at once; there is no
need to erase and redraw each pixel manually to implement a move or a
raise.
But canvases
offer even more power than suggested so far. In addition
to object identifiers, you can also perform canvas operations on
entire sets of objects at once, by associating them all with a
tag
, a name that you make up and apply to objects
on the display. Tagging objects in aCanvasis at least similar in spirit to
tagging substrings in theTextwidget we studied in the prior section. In general terms, canvas
operation methods accept either a single object’s identifier or a tag
name.
For example, you can move an entire set of drawn objects by
associating all with the same tag and passing the tag name to the
canvasmovemethod. In fact, this
is whymovetakes offsets,
not coordinates—when given a tag, each object associated with the tag
is moved by the same (X,Y) offsets; absolute coordinates would make
all the tagged objects appear on top of each other instead.
To associate an object with a tag, either specify the tag name
in the object drawing call’stagoption or call
theaddtag_withtag(tag,canvas method (or its relatives). For
objectIdOrTag)
instance:
canvas.create_oval(x1, y1, x2, y2, fill='red', tag='bubbles')
canvas.create_oval(x3, y3, x4, y4, fill='red', tag='bubbles')
objectId = canvas.create_oval(x5, y5, x6, y6, fill='red')
canvas.addtag_withtag('bubbles', objectId)
canvas.move('bubbles', diffx, diffy)
This makes three ovals and moves them at the same time by
associating them all with the same tag name. Many objects can have the
same tag, many tags can refer to the same object, and each tag can be
individually configured and processed.
As inText,Canvaswidgets have predefined tag names
too: the tagallrefers to all
objects on the canvas, andcurrentrefers to whatever object is under the mouse cursor. Besides asking
for an object under the mouse, you can also search for objects with
thefind_canvas methods
:canvas.find_closest(X,Y), for instance,
returns a tuple whose first item is the identifier of the closest
object to the supplied coordinates—handy after you’ve received
coordinates in a general mouse-click event callback.
We’ll revisit the notion of canvas tags by example later in this
chapter (see the animation scripts near the end if you need more
details right away). As usual, canvases support additional operations
and options that we don’t have space to cover in a finite text like
this (e.g., the canvaspostscriptmethod
lets you save the canvas in a PostScript file). See later examples in
this book, such as PyDraw, for more details, and consult other Tk or
tkinter references for an exhaustive list of canvas object
options.
One canvas-related
operation is so common, though, that it does merit a look
here. As demonstrated in
Example 9-14
, scroll bars can be
cross-linked with a canvas using the same protocols we used to add them
to listboxes and text earlier, but with a few unique
requirements.
Example 9-14. PP4E\Gui\Tour\scrolledcanvas.py
"a simple vertically-scrollable canvas component and demo"
from tkinter import *
class ScrolledCanvas(Frame):
def __init__(self, parent=None, color='brown'):
Frame.__init__(self, parent)
self.pack(expand=YES, fill=BOTH)                  # make me expandable
canv = Canvas(self, bg=color, relief=SUNKEN)
canv.config(width=300, height=200)                # display area size
canv.config(scrollregion=(0, 0, 300, 1000))       # canvas size corners
canv.config(highlightthickness=0)                 # no pixels to border
sbar = Scrollbar(self)
sbar.config(command=canv.yview)                   # xlink sbar and canv
canv.config(yscrollcommand=sbar.set)              # move one moves other
sbar.pack(side=RIGHT, fill=Y)                     # pack first=clip last
canv.pack(side=LEFT, expand=YES, fill=BOTH)       # canv clipped first
self.fillContent(canv)
canv.bind('', self.onDoubleClick)       # set event handler
self.canvas = canv
def fillContent(self, canv):                           # override me below
for i in range(10):
canv.create_text(150, 50+(i*100), text='spam'+str(i), fill='beige')
def onDoubleClick(self, event):                       # override me below
print(event.x, event.y)
print(self.canvas.canvasx(event.x), self.canvas.canvasy(event.y))
if __name__ == '__main__': ScrolledCanvas().mainloop()
This script makes the window in
Figure 9-24
. It is similar to prior scroll
examples, but scrolled canvases introduce two new kinks in the scrolling
model:
- Scrollable versus viewable sizes
You can specify the size of the displayed view window, but
you must specify the size of the scrollable canvas at large. The
size of the view window is what is displayed, and it can be
changed by the user by resizing. The size of the scrollable canvas
will generally be larger—it includes the entire content, of which
only part is displayed in the view window. Scrolling moves the
view window over the scrollable size canvas.- Viewable to absolute coordinate
mapping In addition, you may need to map between event view area
coordinates and overall canvas coordinates if the canvas is larger
than its view area. In a scrolling scenario, the canvas will
almost always be larger than the part displayed, so mapping is
often needed when canvases are scrolled. In some applications,
this mapping is not required, because widgets embedded in the
canvas respond to users directly (e.g., buttons in the PyPhoto
example in
Chapter 11
). If the user
interacts with the canvas directly, though (e.g., in a drawing
program), mapping from view coordinates to scrollable size
coordinates may be necessary.
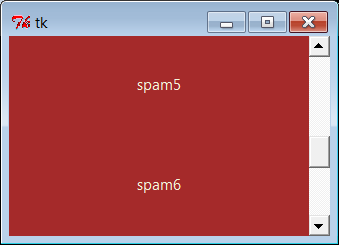
Figure 9-24. scrolledcanvas live
Sizes are given as configuration options. To specify a view area
size, use canvaswidthandheightoptions. To specify an overall canvas
size, give the (X,Y) coordinates of the upper-left and lower-right
corners of the canvas in a four-item tuple passed to thescrollregionoption. If no view area size is
given, a default size is used. If noscrollregionis given, it defaults to the view
area size; this makes the scroll bar useless, since the view is assumed
to hold the entire canvas.
Mapping coordinates is a bit subtler. If the scrollable view area
associated with a canvas is smaller than the canvas at large, the (X,Y)
coordinates returned in event objects are view area coordinates, not
overall canvas coordinates. You’ll generally want to scale the event
coordinates to canvas coordinates, by passing them to thecanvasxandcanvasycanvas methods before using them
to process objects.
For example, if you run the scrolled canvas script and watch the
messages printed on mouse double-clicks, you’ll notice that the event
coordinates are always relative to the displayed view window, not to the
overall canvas:
C:\...\PP4E\Gui\Tour>python scrolledcanvas.py2 0
event x,y when scrolled to top of canvas
2.0 0.0
canvas x,y -same, as long as no border pixels
150 106
150.0 106.0
299 197
299.0 197.0
3 2
event x,y when scrolled to bottom of canvas
3.0 802.0
canvas x,y -y differs radically
296 192
296.0 992.0
152 97
when scrolled to a midpoint in the canvas
152.0 599.0
16 187
16.0 689.0
Here, the mapped canvas X is always the same as the canvas X
because the display area and canvas are both set at 300 pixels wide (it
would be off by 2 pixels due to automatic borders if not for the
script’shighlightthicknesssetting).
But notice that the mapped Y is wildly different from the event Y if you
click after a vertical scroll. Without scaling, the event’s Y
incorrectly points to a spot much higher in the canvas.
Many of this book’s canvas examples need no such scaling—(0,0)
always maps to the upper-left corner of the canvas display in which a
mouse click occurs—but just because canvases are not scrolled. See the
next section for a canvas with both horizontal and vertical scrolls;
the
PyTree program later in this book is similar, but it also
uses dynamically changed scrollable region sizes when new trees are
viewed.
As a rule of thumb, if your canvases scroll, be sure to scale
event coordinates to true canvas coordinates in callback handlers that
care about positions. Some handlers might not care whether events are
bound to individual drawn objects or embedded widgets instead of the
canvas at large, but we need to move on to the next two sections to see
how.