Reverse Deception: Organized Cyber Threat Counter-Exploitation (97 page)
Read Reverse Deception: Organized Cyber Threat Counter-Exploitation Online
Authors: Sean Bodmer
Tags: #General, #security, #Computers

Figure 9-15
Traffic analysis tells a story
.
Checking Out the Competition
Many other SpyEye campaigns that have lengthier life cycles have not necessarily been as successful when it comes to mass infections. Here are two examples:

Both of these CnC hosts were still live when we performed this traffic analysis, and they reflect the more common infection rate that the SpyEye operators are averaging. What is very noticeable is that with the majority of cases observed, the public discovery and detection rate of the CnC host and its activity is significantly behind compared to the actual date of the initial launch of each unique SpyEye operation. This obviously gives the botnet operators a significant edge at this time.
Targets and Taxonomy
We identify many infected targets when analyzing botnets and their intentions, and we confidentially report our findings to the rightful owners of the data. Here, we are going to focus more on the targeted Internet service providers (ISPs) that are hosting the SpyEye CnC systems and binaries. Some of these ISPs appear to be quite lenient in allowing this malicious behavior on their network, and we have researched an eight-month timeline of SpyEye activity, from January 16, 2010, to October 16, 2010. This period covers the majority of known activity conducted by SpyEye operators.
The Facts
Since January 2010, there have been 173 unique domains discovered in the wild and 17 IP addresses hosted on 77 unique ISPs in 24 countries. Many have had a decent life cycle and demonstrated gradual growth over time in use.
Figure 9-16
shows a graph of these attacks over the period from January to October.
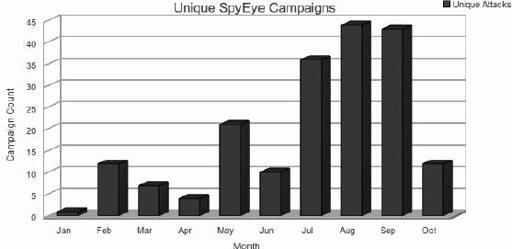
Figure 9-16
190 attacks over eight months
From this data, it is apparent that the summer months saw significant growth for SpyEye activity. Seeing that there were more than 190 known unique SpyEye assaults over an eight-month period suggests that this specific malicious software is growing in popularity and will likely continue to do so.
Location
Within this eight-month period, we observed that the highest density (almost 30 percent) of launches were conducted within Ukrainian (UA) IP address space, as shown in
Figure 9-17
. The Czech Republic (CZ) held second place at 12 percent, and the United States came in third at 8 percent.
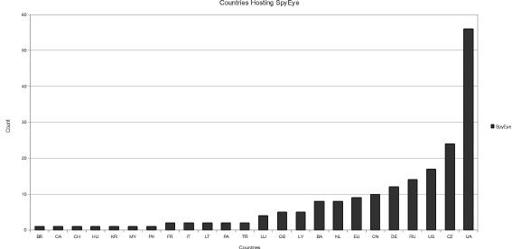
Figure 9-17
Ukraine wins the gold medal
.
Figure 9-16
presented unique SpyEye campaigns over the eight-month timeline, which is useful for identifying its traits for growth and preferred seasons. But by taking it a step further, we can organize the campaigns by location over the defined timeline, as shown in
Figure 9-18
.
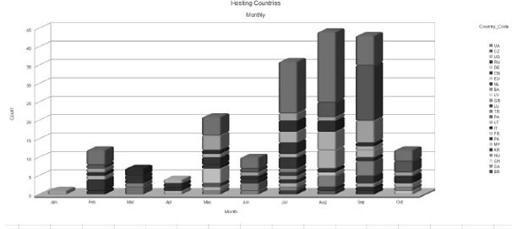
Figure 9-18
Countries playing host
An interesting pattern we see is the high density of Ukraine (UA) appearing mostly within July and August, and tapering down in September. But then we see the Czech Republic (CZ) exercise exponential growth just in September alone. Taking a look at a cluster of CZ ISPs, we can combine the registration, and we’ll notice a very obvious pattern:

This makes it easy to recognize that serial patterns and habits are formed, and enables us to trace back preferences such as specific ISP services and locations.
Internet Service Providers
Table 9-1
lists the identified ISPs involved and their geographic locations.
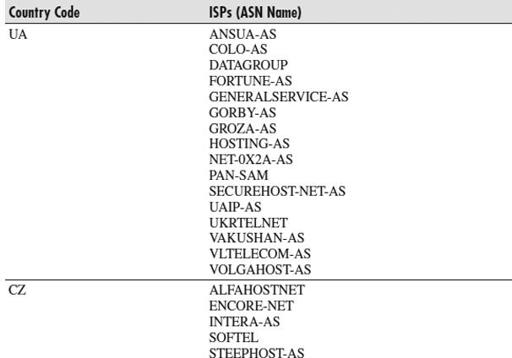
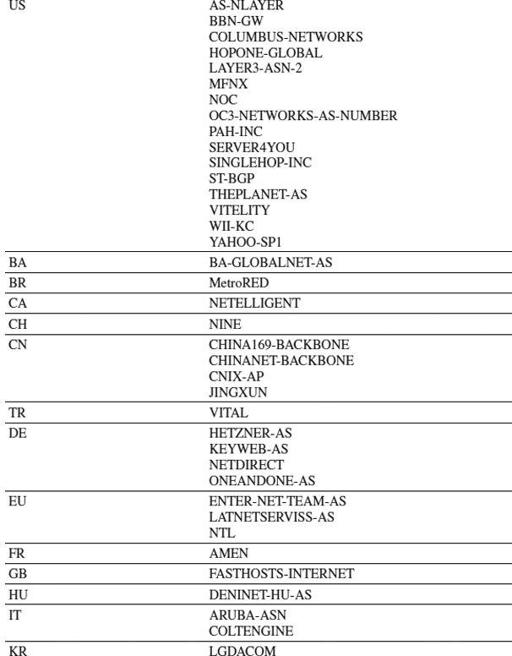
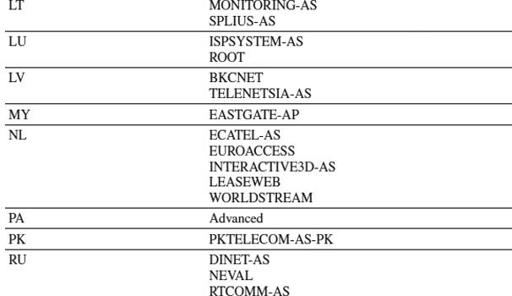
Table 9-1
Involved ISPs
Figure 9-19
shows the ISP distribution among these countries graphically. Both the United States and the Ukraine have 16 ISPs, yet the Ukraine’s hosting usage is more than three times that of the United States. The ratio of US hosting during the eight-month period is rather normal, with two specific modest jumps in May and September.
Figure 9-20
shows the ranking of the ISP usage.
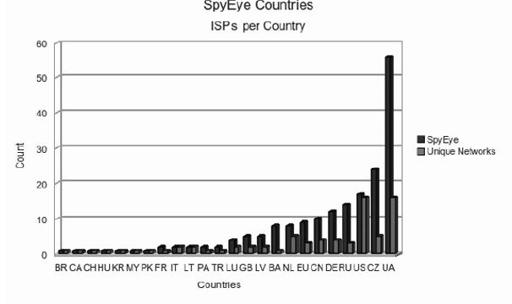
Figure 9-19
Countries with unique ISPs
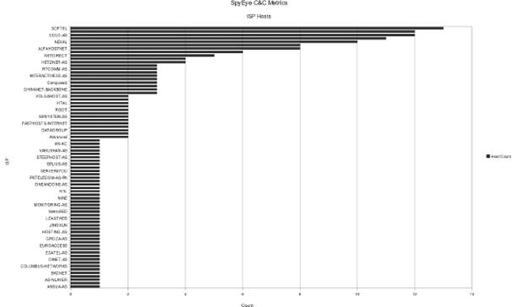
Figure 9-20
Ranked ISP usage