Understanding Sabermetrics (23 page)
Read Understanding Sabermetrics Online
Authors: Gabriel B. Costa,Michael R. Huber,John T. Saccoma

Other significant factors that play into a park’s designation are the overall amount of foul territory, including the distance from home plate to the backstop. The Polo Grounds had what Lowry characterizes as a “huge” foul territory, with a distance from home plate to backstop listed variously from 65 to 74 feet.
But when we look at the effects of ballpark on the number of runs scored, we can get a clearer picture of how it should be viewed by computing the park factor. While there are different formulas for park factor, we will use the basic one:


Note that the numerator of the main fraction is the average of runs scored in the team’s home games, while the denominator of the main fraction is the average of runs scored in the team’s road games. Thus, if more runs are scored on average in the home games than in the road games, the fraction will have a value greater than 1, while if the average runs scored away from home is greater, the fraction will have a value less than 1. This can be figured as a percentage.
Obviously, any offensive statistic can be used in place of runs, provided one has the home/road splits for that statistic. In this way, a park’s propensity for being favorable or unfavorable to that particular statistic can be quantified. Note also that a value of exactly 1 indicates a neutral effect on the statistic in question.
Since the expansion to 12 teams per league and the advent of divisional play in 1969, there were only three ballparks in the National League that were being used then and were still in use in 2006: the Cubs’ Wrigley Field in Chicago, Dodger Stadium in Los Angeles, and the Mets’ Shea Stadium in New York. We compare these three parks for runs production in those two seasons, 37 years apart. In 1969, the National League averaged 4.05 runs per team per game, while in 2006, the figure was 4.76. Both figures are off from the historic norm in major league baseball of 4.5 runs per team per game.
In 1969, the runs scored/runs allowed, home/road splits for the Cubs, Dodgers and Mets are:


Note that the “H” stands for home, “A” stands for away, “RS” for Runs Scored, and “RA” for Runs Allowed.
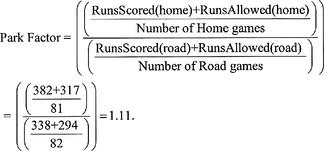
So, for the 1969 Cubs, the park factor for Wrigley Field is
 This can be interpreted that Wrigley Field increased run production by 11 percent over the course of the 1969 season.

Shea and Dodger Stadiums, respectively, have 1969 Park Factors of 0.96 and 0.94 (verify this using the data and the formula). This means Shea and Dodger decreased average run production by 4 percent and 6 percent respectively in 1969.
There is simplicity to this analysis. Often the average over a three-year period or a five-year period is used.
Consider the statistics for the first basemen of those teams that year, Wes Parker, Ernie Banks and Ed Kranepool:


Recall from chapter 6 that, for runs created version HDG-23,
and

A
= H + BB + HBP - CS - GIDP
B
= TB + [0.29 (BB + HBP - IBB)] + [0.53 (SF + SH)] + [0.64 (SB)] - 0.03(K)
C
= AB + BB + HBP + SH + SF

Using HDG-23, the runs-created numbers for these players is 73.58 for Parker, 43.39 for Kranepool and 70.94 for Banks. Applying the park factors to these players’ numbers, we consider that teams play half their games at home and half on the road, so we cut the park factor in half.
In this way, to compute park-adjusted runs created (PARC), we take RC + (1 - PF) × (RC)/2, so if a players’ park factor is higher than 1, we will obtain a negative value for the (1 - PF) term, thus lowering his RC figure. If he plays in a pitchers’ park, his PF will be lower than 1, so (1 - PF) is a positive number, adjusting his RC upward.
Thus, if the home park for Banks increases run totals by 11 percent, his PARC is (70.94) + (1 - 1.11) × (70.94)/2 = 67.04. Parker’s PARC is (73.58) + (1 - 0.94) × (73.58)/2 = 75.78, while Kranepool’s is (43.39) + (1 - 0.96) × (43.39)/2 = 44.26.
Thirty-seven years later, Shea, Dodger and Wrigley have maintained more or less the same outfield dimensions. However, the degree to which each favored hitting or pitching changed slightly. Here are the home and road runs scored and allowed splits for the three teams in 2006:


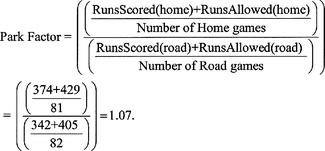
The 2006 PF for Wrigley Field is


It seems as though Wrigley was 4 percent less of a pitchers’ park in 2006 then it was in 1969. What are some possible reasons for this? First, it may be that the number of hitters’ parks league-wide had increased by 2006. In fact, there were 6 hitters’ parks, 5 pitchers’ parks and 1 neutral park in 1969, and in 2006 the totals were 8, 7 and 1, respectively. (You will be asked to verify these assertions in question 4 following this chapter.) However, in 1969, Wrigley Field was the number one hitters’ park in the National League, but in 2006, it was 4th best, behind Cincinnati, Colorado, and Arizona.
What is even more interesting is the swing that occurred with Dodger Stadium. As stated earlier, Dodger Stadium could be seen as reducing run production by 6 percent, the second best pitchers’ park in the National League, after Forbes Field in Pittsburgh. However, by 2006, it was the sixth-best hitters’ park in the NL, with PF = 1.05 (verify this number). How could that be?
While the distances to the fences have not changed appreciably since 1969, according to
Green Cathedrals
, the backstop at Dodger Stadium was 75 feet from home plate in 1969 and 57 feet in 2006. Also, the foul territory was classified as large until 1999 and small since 2005. These factors also contribute to a park favoring a hitter.
Green Cathedrals
, the backstop at Dodger Stadium was 75 feet from home plate in 1969 and 57 feet in 2006. Also, the foul territory was classified as large until 1999 and small since 2005. These factors also contribute to a park favoring a hitter.
It is better to use data from several years in order to determine PF. Very often, a three- or five-year average is used to dampen the effect of a team’s particular strength or weakness in a particular season. Also, the home team’s numbers are “washed out” in some versions of the formula, because home batters and pitchers do not face each other.
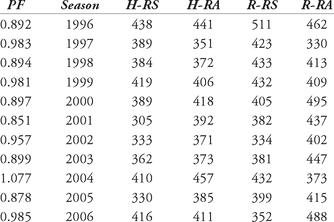
In 1992, the Baltimore Orioles opened Oriole Park at Camden Yards, which represented a renaissance in ballpark design. It combined modern amenities with a design that reminded people of such beloved bygone parks as Ebbets Field. Its success spawned many imitators, and while most of the stadiums built after Camden Yards seem to favor the hitter, Camden Yards has been pitcher-friendly throughout most of its history. In Table 10.1 we show the year-by-year park factors for Camden Yards since 1996, as there was a strike in 1994 and a shortened season in 1995.

Other books
Where Have All the Boys Gone? by Jenny Colgan
Chasing Che by Patrick Symmes
Teatro Grottesco by Thomas Ligotti
Girl and Five Brave Horses, A by Carver, Sonora
Betrayal (The Divine, Book Two) by Forbes, M.R.
Revenge at Bella Terra by Christina Dodd
In Pursuit of Prey: Of Gods and Consorts, Book 1 by Savannah Jordan
The Infernal Device & Others: A Professor Moriarty Omnibus by Michael Kurland
Death Defying (Dark Desires) by Croft, Nina
Kitty Rocks the House by Carrie Vaughn