Understanding Sabermetrics (18 page)
Read Understanding Sabermetrics Online
Authors: Gabriel B. Costa,Michael R. Huber,John T. Saccoma

The HBP and SH data come from the
Stats Inc. Handbook.
Stats Inc. Handbook.
Using the basic runs created formula, the runs-created estimate is within 5 percent of the actual runs total. It can easily be verified that the HDG12 runs created estimate is 5934, so we are now within 1 percent of the total.
The formula used for the 1986 NL is HDG23. Included are sacrifice flies and grounded into double plays. Strikeouts are also incorporated; that year saw NLers establish a new record for number of strikeouts, striking out almost 1000 times more than the previous season.
The runs-created formulas, with some modifications and specifications, can be applied to individual players. In 1986, Mike Schmidt was the Most Valuable Player in the National League, scoring 97 runs and driving in 119. How does that translate into real run production for Philadelphia that season?
Continuing the axiomatic thread of James’ presentation, he states that “the objective of a player is to produce runs,” and “actual runs and RBI are too dependent on external factors.” Thus, runs created, in attempting to determine the number of runs for which a particular player can be credited, attempts to do so in a situation-neutral context.
Here are Schmidt’s 1986 MVP numbers:

which works out to a BRC of 117.3 and a TECHRC of 121.94.
Table 8.6 Mike Schmidt’s 1986 statistics
A = H + BB + HBP - CS - GIDP = 160 + 89 + 7 - 2 - 8 = 246
B = TB + [0.26 (TBB - IBB + HBP)] + [0.52 (SH + SF + SB)]
= 302 + [0.26 (89 - 25 + 7)] + [0.52 (0 + 9 + 84)] = 368.82
C = AB + BB + HBP + SH + SF = 552 + 89 + 7 + 0 + 9 = 657
James’ Third Axiom of Sabermetrics reads: “All offense and defense occurs within a context of outs.” To provide this context, James developed the concept of Offensive Winning Percentage (OWP), in which outs are a kind of “currency” paid to produce runs. A more efficient player, therefore, will produce runs using fewer outs, and theoretically, if two players create the same number of runs, the tie can be broken by compared by how few outs they spend. In a 162-game season, at 27 outs per game, a team will have a basis of 4374 outs. Extra innings, rain-shortened, and unplayed games might change that total, but this is the starting point.
Continuing the analysis of Mike Schmidt, we see that he contributed 409 outs, a figure determined by taking AB - H, and adding SH and SF, outs not counted in the original total. We also add his 8 GIDP, as these are additional outs he caused. These 409 outs translates to 409 / 27 or 15 games (actually, 15.1). The National League in 1986 averaged 4.18 runs per team per game, slightly lower than the usual historical figure of 4.5. On the other hand, at 15.1 games, Schmidt produced 117.3 / 15.1 = 7.74 runs per game using BRC, and 121.94 / 15.1 = 8.05 runs per game using TECHRC. If we put these figures into the Pythagorean Record, we obtain
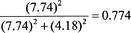 for the basic version, and
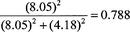 for the technical version.
What this means is that a team of nine Mike Schmidts at the plate, given average pitching and defensive support for the year 1986, would have produced a winning percentage of .774 (or 125 wins) or .788 (128 wins) over the course of the 162-game season. For his 15-game “season,” Schmidt’s offensive win-loss record would round to 12-3 using either winning percentage.
Many fans of the New York Mets would dispute the MVP selection of Schmidt in 1986. However, the player on the Mets with the highest runs created numbers was Keith Hernandez. His 1986 statistics are listed here:

which yield BRC = 101.07 and TECHRC = 103.41 (you can verify these numbers).
Table 8.7 Keith Hernandez’s 1986 statistics
Hernandez used 427 outs, or 16 (15.8) games. You can verify that for the same season, given average pitching and defensive support, a team of nine Keith Hernandezes at bat would have a winning percentage of .700 (BRC) or .710 (TECHRC), 113 or 115 wins in a 162 game season, or a 11-5 record for his 16 games. Thus, those Mets fans who would make Hernandez’s MVP case might be on the wrong track.
HDG23, used for both AL and NL data between from 1955 to 1988, has the following formula:
A = H + BB + HBP - CS - GIDP
B = TB + [0.29 (BB + HBP - IBB)] + [0.53 (SF + SH)] + [0.64 (SB)] - 0.03 (K)
C = AB + BB + HBP + SH + SF
Note how it differs slightly from HDG22, which is used only for the major leagues in 1954:
A = H + BB+ HBP - CS - GIDP
B = 0.98 (TB) + [0.24 (BB + HBP)] + [0.5 (SF + SH)] + [0.62 (SB)] -
0.03 (K)
C = AB + BB + HBP + SH + SF
The main difference in the two years is the recording of intentional walks after 1954.
So, for 1986, factoring in the 11648 strikeouts that year, the totals for HDG23 are:
A
21297,
B
28302,
C
73990 or (21297 × 28302) / 73990 = 8146, within ⅔ of a percentage point of the actual run total.
A
21297,
B
28302,
C
73990 or (21297 × 28302) / 73990 = 8146, within ⅔ of a percentage point of the actual run total.
Since the publication of the 24 HDG runs-created formulas, James has introduced some nuances that bring more situational numbers into the formula, including home runs with the bases empty. However, as always, any element is included because it makes the league estimate more accurate. In one adjustment to the RC formulas, James suggests introducing some coefficients to the A, B and C quantities. Thus, a more accurate runs-created formula, putting the individual player’s numbers into the context of a team, would be
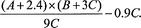
Expanded out, and factoring out the 9, yields
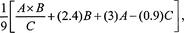 which seems to weight the individual’s numbers as one-ninth of a team’s offense. The other coefficients are unexplained, except that possibly they were arrived at via trial and error using norms throughout baseball history.
In any case, Schmidt’s numbers for HDG23 were A = 246, B = 325.48, and C = 657, so
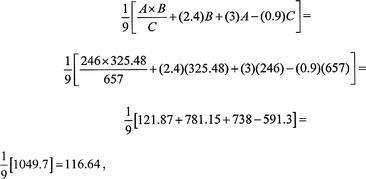 a value that is about 1 run lower than his BRC estimate. Using these coefficients, Keith Hernandez’s runs estimate drops to 97.7.
The formula used for both leagues since 1988 is HDG24. It is slightly different from HDG23, and includes adjustments for home runs with men on base and for hitting with men in scoring position.
Easy Tosses1. Here are some numbers for the American League in 1998:
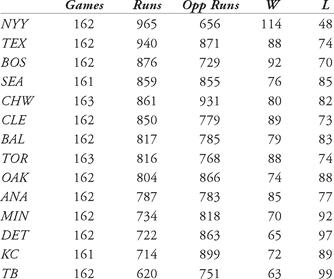
a. Determine the Pythagorean Records for the Texas Rangers (TEX) and the Toronto Blue Jays (TOR). Each team won 88 games that year.
b. Compute the Pythagorean Record for the remaining teams in the American League for 1998. Note that the number of runs and wins do not balance out, as there was interleague play. The AL scored 11 more runs than it allowed in 1998. Which team played the farthest above its projection, and which played the farthest below?
Other books
Lionheart by Sharon Kay Penman
A Very Merry Iona Christmas by M. L. Briers
Surrender to Temptation Part V: Tempted to Reveal by Jameson, Lauren
Mr Scarletti's Ghost by Linda Stratmann
Back to the Fuchsia by Melanie James
Forty Words for Sorrow by Giles Blunt
Lost Daughters by Mary Monroe
Midnight Rising by Lara Adrian
Sion Crossing by Anthony Price
Blazing Hot Bad Boys Boxed Set - A MC Romance Bundle by Glass, Evelyn, Day, Laura, Thomas, Kathryn, Love, Amy, Summers, A. L., Faye, Carmen, Knowles, Tamara, Owen, Candice