Understanding Sabermetrics (15 page)
Read Understanding Sabermetrics Online
Authors: Gabriel B. Costa,Michael R. Huber,John T. Saccoma

Notice that the coefficient for assists is two; assists are doubly weighted because more skill is required to get an assist than to record a putout. Individual players are evaluated by prorating the putouts. In 1971, Mark Belanger recorded 280 putouts in 149 games at shortstop for Baltimore. The Orioles as a team recorded 297 putouts at the shortstop position. Thus, Belanger would get credit for 280/297 = 94.3 percent of the putouts made at short. Using the formulas above, the Orioles shortstop rating in 1971 was 14.25 runs, so Belanger gets credit for 0.943 × 14.25 = 13.43 runs. This left Earl Weaver in a position to decide whether Mark Belanger’s glove was worth more runs than his bat. (Coincidentally, the Blade batted .266 in 1971, 38 points higher than his career average.)
For catchers, Thorn and Palmer modified the defensive linear weights fielding runs by taking strikeouts away from the catchers’ putouts. For first basemen, double plays and putouts were taken away, as they require much less fielding skill except in an occasional instance. This leaves only 0.20 × (2 A - E) in the formula’s numerator. For outfielders, the formula for linear weights is 0.20 × (PO + 4 A-E + 2 DP). Thorn and Palmer conjectured that the “weighting for assists was boosted here because a good outfielder can prevent runs through the threat of assists that are never made; for outfielders, the assist is essentially an elective play.” They counted the three outfielders on each team with the most putouts. The top putout player is designated the center fielder, and then the other two’s totals are pooled. League averages from each group are obtained, and the center fielders are compared to the average for center fielders, whereas the left and right fielders are compared to averages for those positions. There might be a source of error in the calculations, as late-inning substitutes for outfielders make it difficult to count the exact number of innings a player plays. Finally, for defensive runs for pitchers, the innings are known and no problem arises. For pitchers, the outfielder’s formula is modified to subtract individual pitcher strikeouts from the total number of potential outs (to help great strikeout pitchers like Nolan Ryan or Randy Johnson). Further, pitchers’ chances are weighted less than infielders’ assists, which might account for the difference between fly ball and ground ball pitchers.. Thus the formula for pitchers is 0.10 × (PO + 2 A-E + DP).
Armed with this strategy for defensive comparison, we can make an argument for who the greatest defensive catcher of all time might be. In any discussion on catching defense, Johnny Bench is a name that should be included. The fourteen-time National League All-Star won ten Gold Glove Awards as the backstop for the Cincinnati Reds. He established the standard by winning the award every year from 1968 through 1977. In addition, he won the Rookie of the Year Award in 1968 and two Most Valuable Player Awards. His Hall of Fame plaque begins, “Redefined standards by which catchers are measured.” Bench’s career fielding percentage as a catcher was .990, which exceeds the league fielding percentage of .987 over the 17 seasons in which Bench played. Was he the best ever?
Since 1992, Ivan Rodriguez has been recognized as one of the best catchers in the major leagues. From 1992 through 2001, Rodriguez also won ten consecutive Gold Glove Awards, and he has won two more since then, in 2004 and 2006. His twelve awards are a record. He has been named to 13 All-Star squads, has won the American League Most Valuable Player Award (1999), and he sports a career fielding percentage of .991, compared to a league average of .991 over his 16 seasons.
Johnny Bench committed 97 errors in 1742 games as a catcher; through 2006, Ivan Rodriguez had committed 117 errors in 1934 games behind the plate. In his career, Bench had 9249 put-outs and 850 assists; through 16 seasons, Rodriguez had 11676 put-outs and 989 assists. Bench has a career range factor of 5.80 (compared to a league range factor of 5.59); Rodriguez has a career range factor of 6.55 (compared to a league range factor of 5.94). Can we compare them using Fielding Runs? Table 7.5 gives the defensive statistics in tabular form.
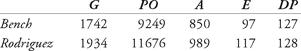
Table 7.5 Defensive statistics for Bench and Rodriguez
For catchers’ fielding runs, Thorn and Palmer remove strikeouts from their put-outs. If they didn’t, this statistic wouldn’t make a whole lot of sense, as it would give credit to pitchers instead of catchers. Unfortunately, that requires that a game-by-game breakdown for each catcher-pitcher pair be conducted, to ensure that each catcher gets credit only for those strikeouts which he caught. That data is not readily available on the web. What to do? We offer a better statistic, “win shares,” which will be reviewed in Inning 7.
As a wrap-up to this chapter, let’s study the career of Jim Kaat. Jim Kitty Kaat was signed by the Washington Senators as an amateur free-agent pitcher in 1957. He debuted in the major leagues for the Senators on August 2, 1959. Over 25 seasons, Kaat pitched for six different big-league teams, finishing his career with a record of 283-237. At his retirement, those 283 victories placed Kaat twentieth on the all-time career victories list (he is now thirtieth). His 898 games played ranks nineteenth all-time among pitchers, and only Cy Young has more games played among pitchers who were primarily starters. Kaat averaged over 27 starts per season (over 25 years). Three times he topped the 20-win mark, three times he was voted to the American League All-Star team, and just once he received votes for the Cy Young Award (finishing 4th in voting in 1975). In addition to being a dependable pitcher, Kitty was an excellent fielder. He won sixteen Gold Glove Awards in consecutive years from 1962 through 1977 (that is second best all-time). Finally, he hit .185 in 1004 at-bats, with 16 home runs and 106 RBIs. Not bad for a pitcher.
Taking these statistics into account, let’s determine the number of pitching runs and fielding runs that Kaat provided his teams. In the tables below we provide his pitching and fielding statistics.

Table 7.6 Jim Kaat’s pitching statistics
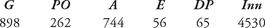
Table 7.7 Jim Kaat’s fielding statistics
Using this information, we see that his pitching runs can be determined as
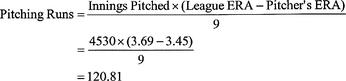
So, over 25 seasons, Jim Kaat prevented 121 more runs than an average pitcher would have given the same number of IP. Although he had fifteen seasons with a winning percentage above .500, and he finished with a .544 winning percentage, he averaged about a half win per season which he contributed to his teams’ successes.
Defensively, recall that as long as the number of innings are known, the linear-weights measure for fielding runs can be calculated with little difficulty.
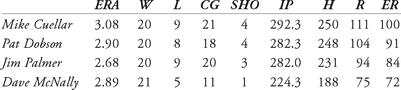
Easy Tosses1. The 1971 Baltimore Orioles had four starting pitchers who won at least 20 games that season. The statistics for Mike Cuellar, Pat Dobson, Jim Palmer, and Dave McNally are listed below. Calculate the pitching runs for each hurler. Given their statistics below, who contributed the most pitching wins for the Orioles that year? The league earned run average was 3.36 runs.
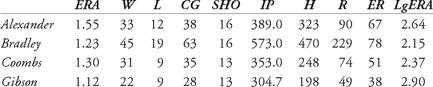
2. Pete Alexander (1916), George Bradley (1876), Jack Coombs (1910), and Bob Gibson (1968) are the only pitchers in history with thirteen or more shutouts in a single season. Alexander also had twelve (1915) and nine twice (1913 and 1919). Calculate their pitching runs.
Note: According to
Baseball-reference.com
, George Bradley gave up 229 runs in 1876, but only 78 were earned! That equates to almost 75 percent of his runs being unearned.
Baseball-reference.com
, George Bradley gave up 229 runs in 1876, but only 78 were earned! That equates to almost 75 percent of his runs being unearned.
3. In 1999, Rafael Palmiero won his third Gold Glove Award as a first baseman. Interestingly, he only played 28 games at first base (he played 135 games as a designated hitter). Compare his fielding runs to five other American League first basemen from 1999.
4. We have seen that Jim Kaat was a great defensive pitcher, having won sixteen Gold Gloves in his career. From 1990 through 2006, Greg Maddux won the award for National League pitchers every year but once (2003, when his teammate Mike Hampton won the award), tying Kaat’s total of 16. Bob Gibson won the coveted defensive award nine consecutive times (from 1965 through 1973). Who contributed a higher average of fielding runs per season, “Mad Dog” Maddux or “Gibby” Gibson?
Other books
The Final Arrangement by Annie Adams
Quantum Theory Cannot Hurt You by Marcus Chown
The Puppet Boy of Warsaw by Eva Weaver
The Ship of Lost Souls 1 by Rachelle Delaney
Mindworlds by Phyllis Gotlieb
The Double Dream of Spring by John Ashbery
A Siren's Song (Ride of the Darkyrie 2) by Saranna DeWylde
Hunted by Cheryl Rainfield
21: The Final Unfinished Voyage of Jack Aubrey by Patrick O'Brian, Patrick O'Brian
A Shade of Vampire 13: A Turn of Tides by Forrest, Bella