More Guns Less Crime (13 page)
Read More Guns Less Crime Online
Authors: John R. Lott Jr
Tags: #gun control; second amendment; guns; crime; violence

time. If concealed-handgun laws were adopted at the peaks of these cycles (say, because concern over crime is great), the ensuing decline in crime might have occurred anyway without any help from the new laws. To deal with this, I controlled not only for national crime patterns but also for individual county patterns by employing burglary or robbery rates to explain the movement in the other crime rates. I even tried to control for individual state trends. Yet the simplest way of concisely illustrating that my results are not merely a product of the "normal" ups and downs in crime rates is to look again at the graphs in figures 4.5—4.9. With the exception of aggravated assault, the drops not only begin right when the laws pass but also take the crime rates well below what they had been before the passage of the laws. It is difficult to believe that, on the average, state legislatures could have timed the passage of these laws so accurately as to coincide with the peaks of crime waves; nor can the resulting declines be explained simply as reversions to normal levels.
Was the Impact of Nondiscretionary Concealed-Handgun Laws the Same Everywhere?
Just as we found that the impact of nondiscretionary laws changed over time, we expect to find differences across states. The reason is the same in both cases: deterrence increases with the number of permits. While the information obtained from state government officials only pertained to why permits were issued at different rates across counties within a
Toble 4.8 Chonge in time trends for crime rotes before ond after the adoption of nondiscretionory lows
Percent change in various crime rates for change in explanatory variable
Violent Aggravated
crime Murder Rape assault
Property Robbery crime Auto theft Burglary Larceny
Change in the crime rate from the difference in the annual change in crime rates in the years before and after the change in the law (annual rate after the law — annual rate before the law)
-0.9%*
-356*
-1.456* -0.5%*
-2.7%*
-0.6%*
-0.3%*
-1.5%*
-0.1%
Note: The control variables are the same as those used in table 4.1, including year and county dummies, though they are not reported, because the coefficient estimates are
very similar to those reported earlier. All regressions use weighted least squares, where the weighting is each county's population. Entire sample used over the 1977 to 1992
period.
*The result is statistically significant at the 1 percent level for a two-tailed t-test.
**The result is statistically significant at the 5 percent level for a two-tailed t-test.
-4-2024
Years before and after the adoption
of concealed-handgun laws
Figure 4.5. The effect of concealed-handgun laws on violent crimes
-6-4-2 0 2 4
Years before and after the adoption of concealed-handgun laws
Figure 4.6. The effect of concealed-handgun laws on murders
3 Q. O
Q.
E
-10
10
Years before and after the adoption of concealed-handgun laws
Figure 4.7. The effect of concealed-handgun laws on rapes
a o
Q.
.Q 9
E
-10
10
Years before and after the adoption of concealed-handgun laws
Figure 4.8. The effect of concealed-handgun laws on robbery rates
CONCEALED-HANDGUN LAWS AND CRIME RATES/79
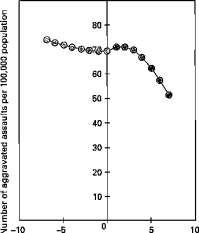
Years before and after the adoption of concealed-handgun laws
Figure 4.9. The effect of concealed-handgun laws on aggravated assaults
given state, the rate at which new permits are issued at the state level may also vary based upon population and population density. If this is true, then it should be possible to explain the differential effect that non-discretionary laws have on crime in each of the states that passed such laws in the same way that we examined differences across counties.
Table 4.9 reexamines my earlier regressions, where I took into account that concealed-handgun laws have different effects across counties, depending upon how lenient officials had been in issuing permits under a previously discretionary system. The one change from earlier tables is that a different coefficient is used for the counties in each of the ten states that changed their laws during the 1977 to 1992 period. At least for violent crimes, the results indicate a very consistent effect of nondiscretionary concealed-handgun laws across states. Nine of the ten states experienced declines in violent-crime rates as a result of these laws, and eight of the ten states experienced declines in murder rates; in the states where violent crimes, murders, or robberies rose, the increases were very small. In fact, the largest increases were smaller than the smallest declines in the states where those crime rates fell.
Generally, the states with the largest decreases in any one category tended to have relatively large decreases across all the violent-crime categories, although the "leader" in each category varied across all the
Table 4.9 State-specific impact of nondiscretionary concealed-handgun laws
Note: The table uses arrest rates adjusted for counties wherein the adoption of nondiscretionary concealed-handgun laws was most likely to represent a real change from past practice by multiplying the nondiscretionary-law variables by the population in each county. The percents are evaluated at the mean county population.
CONCEALED-HANDGUN LAWS AND CRIME RATES/81
violent-crime categories. 37 Likewise, the states with relatively small crime decreases (for example, Georgia, Oregon, Pennsylvania, and Virginia) tended to exhibit little change across all the categories.
Property crimes, on the other hand, exhibited no clear pattern. Property crimes fell in five states and increased in five states, and the size of any decrease or increase was quite small and unsystematic.
Ideally, any comparison across states would be based on changes in the number of permits issued rather than simply the enactment of the nondiscretionary law States with the largest increases in permits should show the largest decreases in crime rates. Unfortunately, only a few states have recorded time-series data on the number of permits issued. I will use such data in chapter 5. For the moment, it is still useful to see whether the patterns in crime-rate changes found earlier across counties are also found across states. In particular, we would like to know whether the largest declines occurred in states with the largest or most dense populations, which we believed had the greatest increase in permits. The justification for the county-level differences was very strong because it was based on conversations with individual state officials, but those officials were not asked to make judgments across states (nor was it likely that they could do so). Further, there is much more heterogeneity across counties, and a greater number of observations. The relationship posited earlier for county populations also seems particularly tenuous when dealing with state-level data because a state with a large population could be made up of a large number of counties with small populations.
With this list of reservations in mind, let us look at the results we get by using state-level density data. Table 4.10 provides the results with respect to population density, and we find that, just as in the case of counties, larger declines in crime were recorded in the most densely populated states. The differences are quite large: the most densely populated states experienced decreases in violent crimes that were about three times greater than the decreases in states with the average density. The results were similar when state populations were taken into account.
Other Gun-Control Laws and Different Types of Concealed-Handgun Laws
Two common restrictions on handguns arise from (1) increased sentencing penalties for crimes involving the use of a gun and (2) waiting periods required before a citizen can obtain a permit for a gun. How did these two types of laws affect crime rates? Could it be that these laws—rather than concealed-handgun laws—explain the deterrent effects? To answer this question, I reestimated the regressions in tables 4.1 and 4.3 by
Table 4.10 Effects of concealed-handgun lows across states related to differences in state population density
Note: The regressions used for this table multiplied the variable for whether the law was enacted by that state's population density. The control variables used to generate these estimates are the same as those used in table 4.1, including year and county dummies, though they are not reported, because the coefficient estimates are very similar to those reported earlier. All regressions use weighted least squares, where the weighting is each state's population.
CONCEALED-HANDGUN LAWS AND CRIME RATES/83
(1) adding a variable to control for state laws that increase sentencing penalties when crimes involve guns and (2) adding variables to measure the impact of waiting periods. 38 It is not clear whether adding an extra day to a waiting period had much of an effect; therefore, I included a variable for when the waiting period went into effect along with variables for the length of the waiting period in days and the length in days squared to pick up any differential impact from longer lengths. In both sets of regressions, the variable for nondiscretionary concealed-handgun laws remains generally consistent with the earlier results. 39 While the coefficients for arrest rates are not reported here, they also remain very similar to those shown previously.
So what about these other gun laws? The pattern that emerges from table 4.11 is much more ambiguous. The results for county-level data suggest that harsher sentences for the use of deadly weapons reduce violent crimes, especially crimes of aggravated assault and robbery. While the same county-level data frequently imply an impact on murder, rape, aggravated assault, and robbery, the effects are quite inconsistent. For example, simply requiring the waiting period appears to raise murder and rape rates but lower the rates for aggravated assault and robbery. The lengths of waiting periods also result in inconsistent patterns: longer periods at first lower and then raise the murder and rape rates, with the reverse occurring for aggravated assault. Using state- level data fails to confirm any statistically significant effects for the violent-crime categories. First, it reveals no statistically significant or economically consistent relationship between either the presence of waiting periods or their length and violent-crime rates. The directions of the effects also differ from those found using county data. Taken together, the results make it very difficult to argue that waiting periods (particularly long ones) have an overall beneficial effect on crime rates. In addition, one other finding is clear: laws involving sentence length and waiting periods do not alter my earlier findings with respect to nondiscretionary laws; that is, the earlier results for nondiscretionary laws cannot merely be reflecting the impact of other gun laws.
The Importance of the Types of Concealed-Handgun Laws Adopted: Training and Age Requirements
Finally, we need to consider how concealed-handgun laws vary across states and whether the exact rules matter much. Several obvious differences exist: whether a training period is required, and if so, how long that period is; whether any minimum age limits are imposed; the number of
Table 4.11 Controlling for other gun laws
State-level regressions
Nondiscretionary law
adopted Enhanced sentencing
law adopted Waiting law adopted Percent change in crime
by increasing the
waiting period by one
day: linear effect Percent change in crime 0.12% -0.13% 0.59%* -0.041% 0.59%** -0.021% 0.05% -0.06% -0.25%
by increasing the
wating period by one
day: squared effect
Note: The control variables are the same as those used in table 4.1, including year and county dummies, though they are not reported, because the coefficient estimates are very similar to those reported earlier. All regressions use weighted least squares, where the weighting is each county's population. *The result is statistically significant at the 1 percent level for a two-tailed t-test. **The result is statistically significant at the 5 percent level for a two-tailed t-test. ***The result is statistically significant at the 10 percent level for a two-tailed t-test.
86/CHAPTER FOUR
years for which the permit is valid; where people are allowed to carry the gun (for example, whether schools, bars, and government buildings are excluded); residency requirements; and how much the permit costs. Six of these characteristics are reported in table 4.12 for the thirty-one states with nondiscretionary laws.
A major issue in legislative debates on concealed-handgun laws is whether citizens will receive sufficient training to cope with situations that can require difficult, split-second decisions. Steve Grabowski, president of the Nebraska state chapter of the Fraternal Order of Police, notes that "police training is much more extensive than that required for concealed-handgun permits. The few hours of firearms instruction won't prepare a citizen to use the gun efficiently in a stress situation, which is a challenge even for professionals." 40 Others respond that significantly more training is required to use a gun offensively, as a police officer may be called on to do, than defensively. Law-abiding citizens appear reticent to use their guns and, as noted earlier, in the majority of cases simply brandishing the gun is sufficient to deter an attack.