More Guns Less Crime (17 page)
Read More Guns Less Crime Online
Authors: John R. Lott Jr
Tags: #gun control; second amendment; guns; crime; violence

Finally, a very limited data set for Arizona produces no significant relationship between the change in concealed-handgun permits and the various measures of crime rates. In fact, the coefficient signs themselves indicate no consistent pattern; the fourteen coefficients are equally divided between negative and positive signs, though six of the specifications imply that the variation in the number of concealed-handgun permits explains at least 8 percent of the variation in the corresponding crime rates. 14 This is likely to occur for several reasons. The sample is extremely small (only 64—89 observations, depending on which specification), and we have only a year and a half over which to observe the effect of the law. In addition, if Arizona holds true to the pattern observed in other states, the impact of these laws is smallest right after the law passes.
The results involving either the mean sentence length for those sen-
A. Murder rates
-6-4-2
-I h
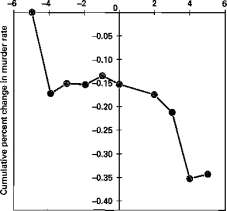
Years before and after implementation of the law
B. Number of permits
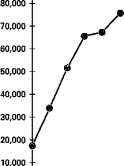
-6 -4 -2 u 2 4 6
Years before and after implementation of the law
Figure 5.2A. Cumulative percent change in Florida's murder rate
Figure 5.2B. Concealed-handgun permits after implementation of the law in Florida
VICTIMS AND THE BENEFITS FROM P ROT E CTI O N / 109
tenced in a particular year or the actual time served for those ending their sentences also imply no consistent relationship between sentence length and crime rates. While the coefficients are negative in eleven of the fourteen specifications, they provide weak evidence of the deterrent effect of longer prison terms: only two coefficients are negative and statistically significant.
The Brady law also went into effect during this period. 15 Using the Arizona data to investigate the impact of the Brady law indicates that its only discernible effect was in the category of aggravated assault, where the statistics imply that it increased the number of aggravated assaults by 24 percent and the number of rapes by 3 percent. Yet it is important to remember that the data for Arizona covered only a very short period of time when this law was in effect, and other factors influencing crime could not be taken into account. While I do not believe that the Brady law was responsible for this large increase in assaults, I at least take this as evidence that the law did not reduce aggravated assaults and as confirmation of the belief that relying on this small sample for Arizona is problematic.
Overall, Pennsylvania's results provide more evidence that concealed-handgun ownership reduces violent crime, murder, rape, aggravated assault, and burglary. For Oregon, the evidence implies that murder and larceny decrease. While the Oregon data imply that the effect of handgun permits on murder is only marginally statistically significant, the point estimate is extremely large economically, implying that a doubling of permits reduces murder rates by 37 percent. The other coefficients for Pennsylvania and Oregon imply no significant relationship between the change in concealed-handgun ownership and crime rates. The evidence from the small sample for Arizona implies no relationship between crime and concealed-handgun ownership. All the results also support the claim that higher arrest and conviction rates deter crime, although—perhaps partly because of the relatively poor quality of the data—no systematic effect appears to arise from longer prison sentences.
Putting Dollar Values on the Crime-Reduction Benefits and Private Costs of Additional Concealed-Handgun Permits
By combining evidence that additional concealed handguns reduce crime with the monetary estimates of victim losses from crime produced by the National Institute of Justice, it is possible to attach a monetary value to the benefits of additional concealed-handgun permits. While the results for Arizona imply no real savings from reduced crime, the estimates for
Pennsylvania indicate that potential costs to victims are reduced by $5,079 for each additional concealed-handgun permit, and for Oregon, the savings are $3,439 per permit. As noted in the discussion of table 4.2, the results are largely driven by the effect of concealed handguns in lowering murder rates (with savings of $4,986 for Pennsylvania and $3,202 for Oregon). 16
These estimated gains appear to far exceed the private costs of owning a concealed handgun. The purchase price of handguns ranges from $100 or less for the least-expensive .25-caliber pistols to over $700 for the newest, ultracompact, 9-millimeter models. 17 The permit-filing fees can range from $19 every five years in Pennsylvania to a first-time, $65 fee with subsequent five-year renewals at $50 in Oregon, which also requires several hours of supervised safety training. Assuming a 5 percent real interest rate and the ability to amortize payments over ten years, purchasing a $300 handgun and paying the licensing fees every five years in Pennsylvania implies a yearly cost of only $43, excluding the time costs incurred. The estimated expenses are higher for Oregon, because of the higher fees and the costs in time and money of obtaining certified safety instruction. Even if these annual costs double, however, they are still quite small compared to the social benefits. While ammunition purchases and additional annual training would increase annualized costs, the long life span of guns and their resale value work to reduce the above estimates.
The results imply that handgun permits are being issued at much lower than optimal rates, perhaps because of the important externalities not directly captured by the handgun owners themselves. While the crime-reducing benefits of concealed handguns are shared by all those who are spared being attacked, the costs of providing this protection are borne exclusively by permit holders.
Accidental Deaths and Suicides
Even if nondiscretionary handgun permits reduce murder rates, we are still left with the question of what happens to the rates for accidental death. As more people carry handguns, accidents may be more likely. Earlier, we saw that the number of murders prevented exceeded the entire number of accidental deaths. In the case of suicide, the nondiscretionary laws increase the probability that a gun will be available when an individual feels particularly depressed; thus, they could conceivably lead to an increase in the number of suicides. While only a small portion of accidental deaths are attributable to guns (see appendix 4), the question remains whether concealed-handgun laws affect the total number of deaths through their effect on accidental deaths.
VICTIMS AND THE BENEFITS FROM P ROT E C T I O N / 111
To get a more precise answer to this question, I used county-level data from 1982 to 1991 in table 5.6 to test whether allowing concealed handguns increased accidental deaths. Data are available from the Mortality Detail Records (provided by the U.S. Department of Health and Human Services) for all counties from 1982 to 1988 and for counties with populations over 100,000 from 1989 to 1991. The specifications are identical to those shown in all the previous tables, with the exceptions that they no longer include variables related to arrest or conviction rates and that the variables to be explained are either measures of the number of accidental deaths from handguns or measures of accidental deaths from all other nonhandgun sources.
While there is some evidence that the racial composition of the population and the level of welfare payments affect accident rates, the impact of nondiscretionary concealed-handgun laws is consistently both quite small economically and insignificant statistically. The first estimate in column 1 implies that accidental deaths from handguns rose by about 0.5 percent when concealed-handgun laws were passed. With only 200 accidental handgun deaths nationwide during 1988 (22 accidental handgun deaths occurred in states with nondiscretionary laws), the implication is that enacting concealed-handgun laws in states that currently do not have them would increase the number of deaths by less than one (.851 deaths). Redoing these tests by adding together accidental handgun deaths and deaths from "unknown" types of guns produces similar results.
With 186 million people living in states without concealed-handgun laws in 1992, 18 the third specification implies that implementing such laws across those remaining states would have resulted in about nine more accidental handgun deaths. 19 Combining this finding with earlier estimates from table 4.1, we find that if the rest of the country had adopted concealed-handgun laws in 1992, the net reduction in total deaths would have been approximately 1,405 to 1,583.
One caveat should be added to these numbers, however: both columns 2 and 4 indicate that accidental deaths from nonhandgun sources increased by more than accidental deaths from handguns after the nondiscretionary concealed-handgun laws were implemented. To the extent that the former category increased because of uncontrolled factors that also increase accidental deaths from handguns, the results presented here are biased toward finding that concealed-handgun laws have increased accidental deaths from handguns.
Finally, I examined similar specifications using data on suicide rates. The possibility exists that if a person becomes depressed while away from home, the presence of a concealed handgun might encourage that person
Table 5.6 Did nondiscretionary concealed-handgun laws increase the number of accidental deaths? (1982-91 county-level data)
Deaths per 100,000 population
Change in explanatory variable
Nondiscretionary law adopted
Percent change in crime (for Tobit number of deaths per 100,000) for an increase in population of one person per square mile
Percent change in crime (for Tobit number of deaths per 100,000) for an increase in $1,000 of real per-capita personal income
2.67%
-5.7%*
4.4%
-9%*
Note: While not all the coefficient estimates are reported, all the control variables are the same as those used in table 4.1, including year and county dummies. Absolute t-statistics are in parentheses. All regressions weight the data by each county's population. *The result is statistically significant at the 1 percent level for a two-tailed t-test. "The result is statistically significant at the 10 percent level for a two-tailed t-test.
VICTIMS AND THE BENEFITS FROM P ROTE C TI O N / 113
to act impulsively, whereas an enforced delay might ultimately prevent a suicide. If anything, the results implied a statistically insignificant and small increase in suicides (less than one-tenth of 1 percent). Hence it is reasonable to conclude that no relationship exists between concealed-handgun laws and suicide rates.
Total Gun Ownership and Crime
Traditionally, people have tried to use cross-county comparisons of gun ownership and crime rates to determine whether gun ownership enhances or detracts from safety. 20 Worldwide, there is no relationship between gun ownership and crime rates. Many countries, such as Switzerland, Finland, New Zealand, and Israel, have high gun-ownership rates and low crime rates, while many other countries have both low gun-ownership rates and either high or low crime rates. For example, in 1995 Switzerland's murder rate was 40 percent lower than Germany's despite having a three-times higher gun-ownership rate. Yet, making a reliable comparison across countries is an arduous task simply because it is difficult to obtain gun-ownership data both over time and across countries, and to control for all the other differences across the legal systems and cultures across countries. International comparisons are also risky because polls underreport ownership in countries where gun ownership is illegal, and they are conducted by different polling organizations that ask questions in widely differing ways. How crime is measured also varies across countries.
Fortunately, more consistent data are available to investigate the relationship between total gun ownership in the United States and crime. In chapter 3 I presented poll data from general-election surveys that offer consistent polling across states, showing how gun ownership varied across states for 1988 and 1996. There is broad variation in gun ownership across states, and the crime rates also vary across states and over time. Even with rather few observations, however, these data suggest that we may be able to answer an obvious question: Is the crime rate higher in states with more guns?