Triumph and Tragedy in Mudville (14 page)
Read Triumph and Tragedy in Mudville Online
Authors: Stephen Jay Gould

I can now
state, in a few sentences, my theory about trends in general and .400 hitting in particular (sorry for the long cranking up, and the slow revving down to come, but simple ideas with unconventional contexts require some exposition if they hope to become reader-friendly). Athletes have gotten better (the world in general has become bigger, faster, and more efficient—this may not be a good thing at all; I merely point out that it has happened). We resist this evident trend by taking refuge in the myth of ancient heroes. The myth can be exploded directly for sports with absolute clock standards. In a system with relative standards (person against person)—especially when rules are subtly adjusted to maintain constancy in measures of average performance—this general improvement is masked and cannot be recovered when we follow our usual traditions and interpret figures for average performances as measures of real things. We can, however, grasp the general improvement of systems with relative standards by a direct study of variation—recognizing that variation itself is a
decline in variation
. Paradoxically, this decline produces a decrease in the difference between average and stellar performance. Therefore, modern leaders don’t stand so far above their contemporaries. The “myth” of ancient heroes—the greater distance between average and best in the past—actually records the improvement of play through time.
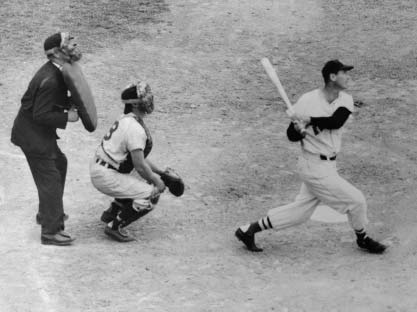
Ted Williams, the last major leaguer to finish a season hitting .400, belts a home run in a 1953 Red Sox–Cleveland Indians game.
Credit: Bettmann/Corbis
Declining variation becomes the key to our puzzle. Hitting .400 isn’t a thing in itself, but an extreme value in the distribution of batting averages (I shall present the data for this claim below). As variation shrinks around a constant mean batting average, .400 hitting disappears. It is, I think, as simple as that.
Reason one for declining variation:
Approach to the outer limits of human capacity.
Well-off people in developed nations are getting taller and living longer, but the trend won’t go on forever. All creatures have outer limits set by evolutionary histories. We’re already witnessing the approach to limits in many areas. Maximum life span isn’t increasing (although more and more people live long enough to get a crack at the unchanging heights). Racehorses have hardly speeded up, despite enormous efforts of breeders and the unparalleled economic incentive for shaving even a second off top performance (Kentucky Derby winners averaged 2:06.4 during the 1910s and 2:02.0 for the past ten years). Increase in human height has finally begun to level off (daughters of Radcliffe women are now no taller than their mothers). Women’s sports records are declining rapidly as opportunity opens up, but some male records are stabilizing.
We can assess all these trends, and the inevitable decline in improvement as we reach the outer limits, because we measure them by absolute clock standards. Baseball players must also be improving, but the relative standard of batting averages, maintained at a mean of about .260, masks the advance. Let’s assume that the wall at the right in the top diagram (opposite page) represents the outer limit, and the bell-shaped curve well to its left marks variation in batting prowess one hundred years ago. I suspect that all eras boast a few extraordinary individuals, people near the limits of body and endurance, however lower the general average. So, a few players resided near the right wall in 1880—but the average Joe stood far to their left, and variation among all players was great. Since then, everyone has improved. The best may have inched a bit toward the right wall, but average players have moved substantially in that direction. Meanwhile, increasing competition and higher standards have eliminated very weak hitters (once tolerated for their superior fielding and other skills).

The disappearance of .400 hitters is the paradoxical result of improvement in play, even as average batters (.260) converge upon the wall of human limits.
So as average players approach the limiting right wall (bottom diagram), variation decreases strongly on both flanks—at the high end for simple decline in space between the average and the limit, and at the low end by decreasing tolerance as general play improves. The relative standards of baseball have masked this trend; hitting has greatly improved, but we still measure its average as .260 because pitching has gained in concert. We can, however, assess this improvement in a different way—by inevitable decline in variation as the average converges on the limiting wall. Modern stars may be an inch or two closer to the wall—they’re absolutely better (or at least no worse) than ancient heroes. But the average has moved several feet closer—and the distance between ordinary (kept at .260) and best has decreased. In short, no more .400 hitters. Ironically, the disappearance of .400 hitting is a sign of improvement, not decline.
Reason two (really the same point stated differently):
Systems equilibrate as they improve.
Baseball was feeling its way during the early days of major league play. Its rules were our rules, but scores of subtleties hadn’t yet been developed or discovered; rough edges careered out in all directions from a stable center. To cite just a few examples (again from Bill James): pitchers began to cover first base in the 1890s; during the same decade, Brooklyn invented the cut-off play, while the Boston Beaneaters developed the hit-and-run and signals from runner to batter. Gloves were a joke in those early days—just a little leather over the hand, not a basket for trapping balls. In 1896 the Phillies actually experimented for seventy-three games with a lefty shortstop. Traditional wisdom applied. He stank; he had the worst fielding average and the fewest assists in the league among regular shortstops.
In an era of such experiment and indifference, truly great players could take advantage in ways foreclosed ever since. “Wee Willie” Keeler could “hit ’em where they ain’t” (and bat .432 in 1897) because fielders didn’t yet know where they should be. Consider the predicament of a modern Wade Boggs or a Rod Carew. Every pitch is charted, every hit mapped to the nearest square inch. Fielding and relaying have improved dramatically. Boggs and Keeler probably stood in the same place, just a few inches from the right wall of human limits, but average play has so crept up on Boggs that he lacks the space for taking advantage of suboptimality in others. All these improvements must rob great batters of ten or twenty hits a year—more than enough to convert our modern best into .400 hitters.
To summarize, variation in batting averages must decrease as improving play eliminates the rough edges that great players could exploit, and as average performance moves toward the limits of human possibility and compresses great players into an ever decreasing space between average play and the unmovable right wall.
In an article
I wrote for
Vanity Fair
, I measured this decline of variation about a constant average on the cheap. I simply took the five highest and five lowest averages for regular players in each year and compared them with the league average. I found that differences between both average and highest and between average and lowest have decreased steadily through the years (see chart, next page). The disappearance of .400 hitting—the most discussed and disputed trend in the history of baseball—isn’t a reflection of generally higher averages in the past (for no one hit over .400 during the second decade of exalted averages, from 1931 to 1940, and most .400 hitting in our century occurred between 1900 and 1920, when averages stood at their canonical [and current] .260 level). Nor can this eclipse of high hitting be entirely attributed to the panoply of conventional explanations that view .400 averages as a former “thing” now extinct—more grueling schedules, too many night games, better fielding, invention of the slider, and relief pitching. For .400 hitting isn’t a thing to be extirpated, but an extreme value in a distribution of variation for batting averages. The reasons for declining variation, as presented above, are different from the causes for disappearance of an entity. Declining variation arises as a general property of systems that stabilize and improve while maintaining constant rules of performance through time. The extinction of .400 hitting is, paradoxically, a mark of increasingly
better
play.
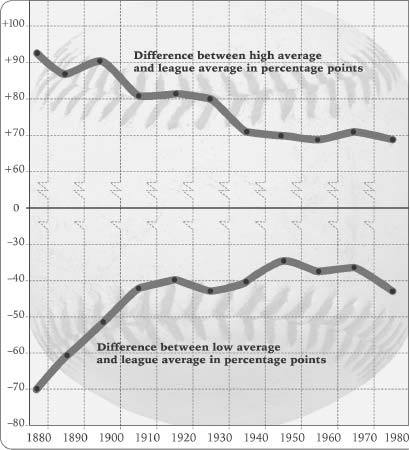
Batting averages are neither as high nor as low as they used to be.
We have now calculated the decline of variation properly, and at vastly more labor (with thanks to my research assistant Ned Young for weeks of work, and to Ed Purcell, Nobel laureate and one of the world’s greatest physicists—but also a serious fan with good ideas). The standard deviation is a statistician’s basic measure of variation. To compute the standard deviation, you take (in this case) each individual batting average and subtract it from the league average for that year. You then square each value (multiply it by itself) in order to eliminate negative numbers for batting averages below the mean (a negative times a negative gives a positive number). You then add up all these values and divide them by the total number of players—giving an average squared deviation of individual players from the mean. Finally, you take the square root of this number to obtain the average, or standard, deviation itself. The higher the value, the more extensive, or spread out, the variation.
We calculated the standard deviation of batting averages for each year (an improvement from my former high and low five, but much more work). The chart on “Chapter 20: Why No One Hits .400 Any More” plots the trend of standard deviations in batting averages year by year. Our hypothesis is clearly confirmed. Standard deviations have been dropping steadily and irreversibly. The decline itself has decelerated over the years as baseball stabilizes—rapidly during the nineteenth century, more slowly through the twentieth, and reaching a stable plateau by about 1940.
If I may make a personal and subjective comment, I was stunned and delighted (beyond all measure) by the elegance and clarity of this result. I pretty well knew what the general pattern would be because standard deviations are so strongly influenced by extreme values (a consequence of squaring each individual deviation in the calculation)—so my original cheap method of five highest and lowest produced a fair estimate. But I never dreamed that the decline would be so regular, so devoid of exception of anomaly for even a single year—so unvarying that we could even pick out such subtleties as the deceleration in decline. I’ve spent my entire professional career studying such statistical distributions, and I know how rarely one obtains such clean results in better behaved data of controlled experiments or natural growth in simple systems. We usually encounter some glitch, some anomaly, some funny years. But the decline of standard deviation for batting averages is so regular that it looks like a plot for a law of nature. I find this all the more remarkable because the graph of averages themselves through time shows all the noise and fluctuations expected in natural systems. Yet mean batting averages have been constantly manipulated by the moguls of baseball to maintain a general constancy, while no one has tried to monkey with the standard deviation. Thus, while mean batting averages have gone up and down to follow the whims of history and the vagaries of invention, the standard deviation has marched steadily down at a decreasing pace, apparently perturbed by nothing of note. I regard this regularity of decline as further evidence that decreasing variation through time is the primary predictable feature of stabilizing systems.