125 Physics Projects for the Evil Genius (5 page)
Read 125 Physics Projects for the Evil Genius Online
Authors: Jerry Silver

Figure 2-2
Motion match results. Courtesy PASCO
.
Zero velocity
means the distance stays the same over a given time interval. This is represented as a horizontal line on the distance versus time graph.
A curved line would be produced by accelerated motion (speeding up or slowing down).
The distance an object goes in a given time interval,
t
, is given by the equation:
d = d
o
+ vt
From this equation, the slope of the distance versus time graph is given by
v
, the velocity of the motion. The initial separation from the motion sensor, d
o
, determines how far above the baseline the graph starts.
Each new phase of the motion contributes a separate segment to the graph. For instance, if the velocity stops, the distance remains constant for that period of time. If the motion is toward the motion sensor for another period of time, that motion contributes a segment of the graph with a negative slope that connects to the other segments.
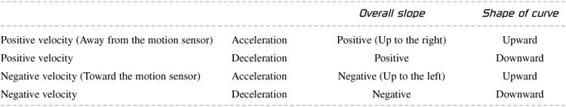
Table 2-1
summarizes the various possibilities.
Table 2-1
- On a piece of paper, draw the following moves (or make up your own):
- Forward 1 meter in three seconds
- In place four seconds
- Back 0.5 meter in two seconds
- Forward 2.5 meters in four seconds
- In place four seconds
- Back 1 meter in three seconds
- How far did you get?
- What was your
displacement
? (This is the
total distance you traveled from your starting point
.) - What was your average velocity? This is the
displacement divided by the total time
(including the time standing in place). - What was the total distance you traveled? Unlike displacement, every forward and backward move contributes to distance.
- What is your
overall speed
? Your overall speed is the
distance divided by the total time
. The total time is the same for both of these.
The results of the treasure hunt is:
- Total time = 20 seconds
- Displacement from the starting point = + 1 + 0 − 0.5 + 2.5 + 0 − 1 = 2.0 meters
- Average velocity = 2 meters / 20 seconds = 0.1 meters per second
- Total distance traveled = +1 + 0 + 0.5 + 1.5 + 0 + 1 = 4 meters
- Overall speed = 4 meters / 20 seconds = 0.2 meters per second
Make your own distance versus time challenges:
- Select any of the Easy Screen Patterns.
- Using a transparency marker (erasable or not is your choice) and trace the rectangular shape defining the Easy Screen Graph.
- Draw your own motion pattern on the transparency.
- Tape the transparency on the screen, so the rectangle aligns with the one you traced on the screen.
- Match your pattern by adjusting your distance as before. This time, you will be ignoring the Easy Screen Pattern and following only your own.
Once you get the hang of it, you can throw in accelerated motion. Acceleration (away from the motion sensor) is represented by an upward sloping line, which is curved upward. Acceleration (toward the motion sensor) is represented by a downward sloping line that is curved downward.
Constant velocity is represented by a straight line on the distance versus time graph. The velocity is given by the slope of the line.
If the curve is not a straight line at any point this indicates that acceleration has occurred. Acceleration can be either positive (speeding up) or negative (called deceleration or slowing down).
An object moving in a particular direction (forward or backward) can experience either positive or negative acceleration.
The tortoise and the hare. Playing catch-up
.
One car is going faster than the other, but the slower car has a head start. We can predict where and when the faster car will overtake the slower car. All we have to do is graph the movement of each car and see where the lines cross. This experiment gives you a method to make that prediction.
- 2 toy cars with adjustable speeds
- stopwatch
- tape measure
1. Set the speed of each of the two cars, so one is faster than the other. (If you don’t know the speeds before starting, you can measure them in the following steps.)
2. Determine the average velocity of each of the cars by measuring the distance it goes in a given amount of time. The equation is average velocity = (distance traveled) divided by (time to get there). In physics, meters are typically used to measure distance (to be consistent with the
SI
or
System International
unit system). This will result in velocity measured in meters per second (m/s). However, you can work with other units for distance (such as feet per second)
as long as you are consistent
.
3. Line up the two cars in the same direction on a level floor heading in the same direction, as shown in
Figure 3-1
.
4. We are going to give the slower car a head start of a few seconds and try to predict where the faster car will overtake the slower car.
5. To do this:
- Plot the speed of the faster car on a graph of distance versus time with the line starting at the origin and having a slope equal to the speed of the faster car.
- Plot the speed of the slower car on the same graph, but starting at a point where the distance is zero and the time is equal to the chosen time delay.
- See
Figure 3-2
, which shows a slower car going at 0.25 meter per second car given a 0.25 meter head start in front of a faster car going 0.4 meter per second. (Notice the slower car is predicted to overtake the faster car at a point that is 0.68 meters from the starting point and 1.8 seconds after the race starts.)
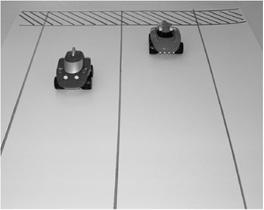
Figure 3-1
When will the faster car overtake the slower one
?

Figure 3-2
Faster car passes the slower car where and when lines cross
.
6. Predict where the faster car you are working with will overtake the slower car.
7. Start the slower car and give it a head start.
Expected Results8. Compare where and when the faster car will overtake the slower car with your predictions.
The faster car will overtake the slower car when the two lines in the graph cross. The distance the lines cross at is how far from the starting line the faster car catches the slower car.
The time where the lines cross is how many seconds from the start of the race when the slower car catches the faster car.
The distance that a object goes is given by the equation:
d = d
o
+ v(t − t
o
)
where
d
o
is the initial distance between where the object starts and the starting line. (d
o
can be understood as the head start in distance)
v
is the velocity of the car
t
is the time it has been going from the start of the race, and
t
o
is the delay or the head start in seconds given to the other car.
Here are some alternative ways of doing this:
- If you have two motion sensors, focus one on the faster car and the other on the slower car. This generates a similar curve as shown in
Figure 3-2
. If the cars are moving
away
from you a similar curve will be produced, except the slope will be positive. - Another way to establish two different velocities is to use objects rolling off two different slopes starting from different heights. The object starting from the higher starting point will be rolling on the table or floor with a higher velocity, with the velocity proportionate to the height difference. If the bottoms of each of the ramps are the same distance from the starting line, the slower rolling object can be given a few seconds head start. A similar prediction and comparison of results can be made as in the previous section.
- If you happen to be associated with a FIRST robotics team, you may want to consider using last year’s robot(s) for this experiment.
- Another variation is to predict where and when two cars moving toward each other will meet.
Two objects that move independently can be represented by separate equations that represent the relationship between distance and time. These are two simultaneous equations, which can be solved graphically to find the time and distance that the faster object overtakes the slower object.
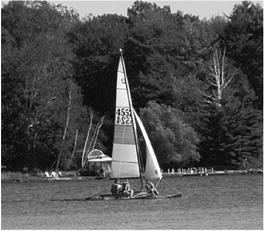
How does a sailboat sail against the wind? Components of force
.
It is not hard to understand how a good stiff wind blowing from behind a sailboat can move it along at a brisk pace in the water. But what about getting back home? How can a sailboat move (or
tack
) against the wind?
In this project, you discover how a sailboat moving
against
the wind can result in a force that pushes the sailboat
forward
. This gets to the idea of how a force in one direction can be broken down into separate component forces. Two methods are shown here. The first method uses a sail attached to a pulley on a string. The second method uses an air track for those readers who have access to one. After looking at these methods, you are encouraged to try one or both of these, or to come up with your own idea.