125 Physics Projects for the Evil Genius (38 page)
Read 125 Physics Projects for the Evil Genius Online
Authors: Jerry Silver

Other sounds are complex mixtures of simpler forms. For instance, a synthesized rock organ consists of a wider range of overtones combined with the fundamental tone.
Figure 64-2
shows several higher frequencies combined with a 440 Hz fundamental.
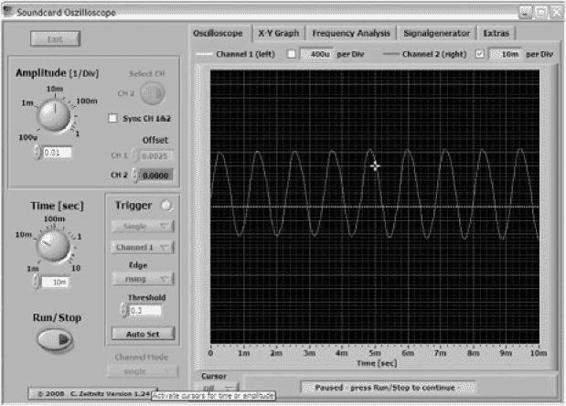
Figure 64-1
Synthesizer flute setting
.
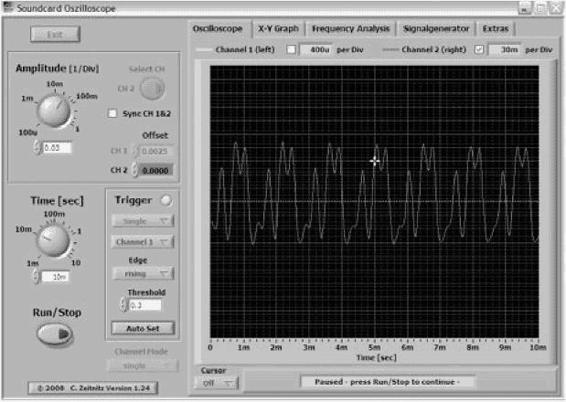
Figure 64-2
Synthesizer rock organ setting
.
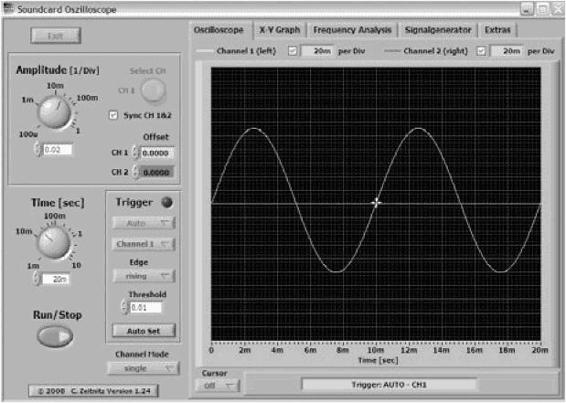
Figure 64-3
100 Hz tone
.
Adding two waveforms results in a combined sound.
Figure 64-3
shows a 100 Hz tone and
Figure 64-4
shows a 400 Hz tone.
Figure 64-5
shows both of these tones combined. The overall pattern shows how both of these tones add to produce a combined wave pattern.
Musical sounds are complex mixes of many individual frequencies with a large variety of overtones.
Figure 64-6
is a sample from The Beatles and
Figure 64-7
is an Allison Krause fiddle solo.
An oscilloscope can also show the mix of frequencies in a particular sound. For instance, a synthesizer violin sound when playing a 440 Hz tone also has some overtones at 880 Hz and 1360 Hz, as shown in
Figure 64-8
.
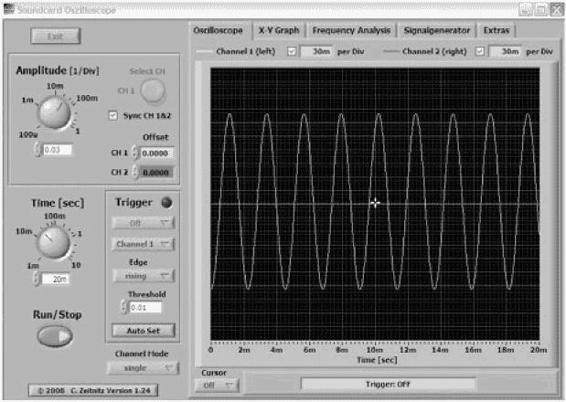
Figure 64-4
400 Hz tone
.
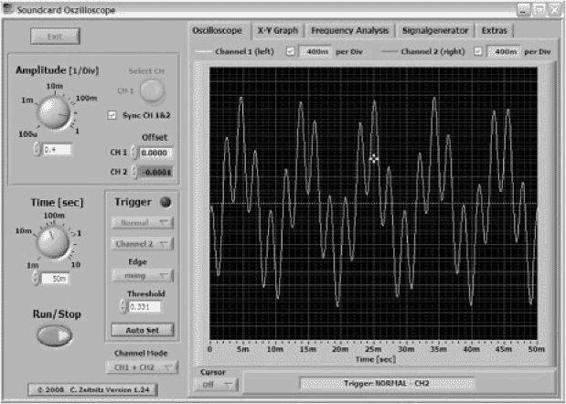
Figure 64-5
100 Hz combined with 400 Hz tones
.
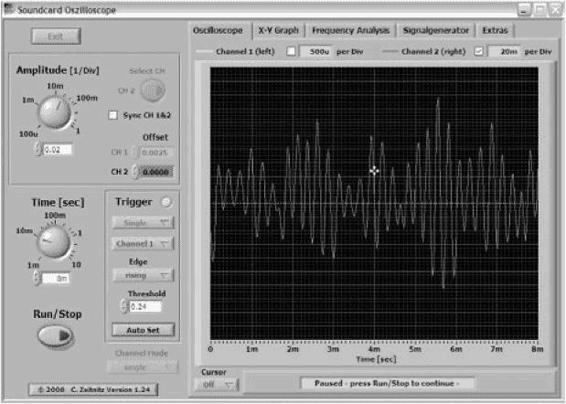
Figure 64-6
“Eleanor Rigby” by The Beatles
.
The mix of overtones contributes to establishing the musical identities of various instruments. For instance, a recorder has a very pure tone with very few overtones. Other sounds, such as a rock organ or a distorted bass, have a much more complex mix of overtones.
An oscilloscope processes an electrical signal and displays it in various ways. The origin of the electrical signal may be a microphone that converts a sound pattern into an electrical pattern, which the oscilloscope can work with. The most basic form of display is a single signal versus time. The scales are adjustable to permit a wide range of signals to be displayed. Oscilloscopes also display two signals both individually on the same screen or added. A plot of one signal against the other and a distribution of frequencies are also common options.
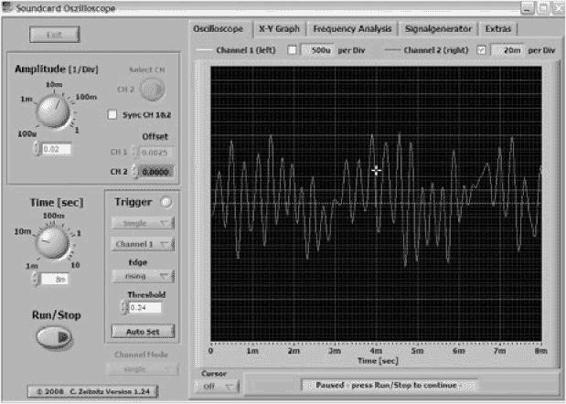
Figure 64-7
The high-lonesome sound of a bluegrass fiddle
.
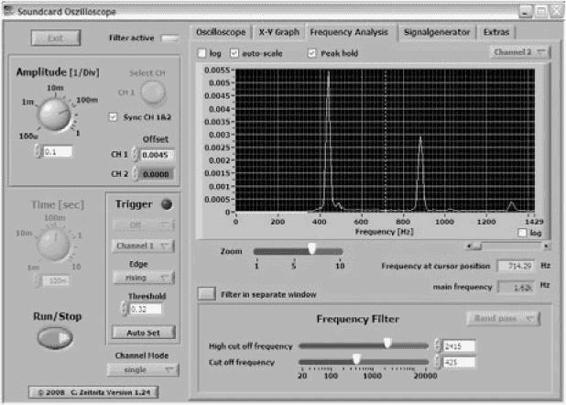
Figure 64-8
Frequency distribution of a 440 Hz violin tone showing overtones
.
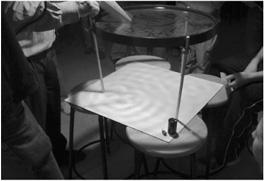
Here is a low-tech way of picturing sound: Cover a soup can (clean, empty, and with the top removed) with Latex or other rubbery material. Put it on tight, like a drum. Attach it with a wire tie, hose clamp, or good string. Glue a small
(roughly 1 centimeter on a side) piece of mirror to the top of the Latex. To use it, hold the can in one hand and shine a laser on the mirror, so the beam projects onto the ceiling (or a wall). If you don’t have a laser, direct sun works as well. With the light reflecting off the mirror, create sounds that will cause the Latex to vibrate. Because of the optical geometry, the movement of the reflected laser is larger (amplified) than the smaller movement of the mirror. Because the “drum” will be vibrating in two dimensions, it is not hard to generate the Lissajous patterns where the reflected light retraces a curved path.
Sound is a wave that, if converted into an electrical signal, can be displayed in a graphical form.
Ripple tank
.
Water waves are probably the most tangible type of wave. For this reason, water waves can be useful in studying wave properties in general. A ripple tank provides a simple, convenient way to produce and study waves and the various types of obstacles they can encounter.
- shallow tray or tank with a transparent bottom or commercially available ripple tank
- water
- bright light that can be held or mounted above the tank
- one or several plain sheets of white poster board to serve as a screen on which to view the images produced by the ripple tank
- various props including a straight wall, a curved wall, a thick glass plate about one-half the thickness of the water in the tank, a cup, a pencil, and a manual or mechanical source of ripples
- optional: a way to project the shadows generated, such as an overhead project or a video monitor
- Set up the tank with the light overhead. The shadow pattern should be visible on the floor.
- Adjust the height of the light above the tank and the screen below the tank to give the best focus of the shadows from the ripples on the floor.
- Using the tip of a ruler, tap the surface of the water to produce ripples. If you have a vibrating ripple generator, using that might give more consistent results and you won’t get tired as quickly from making ripples.
- You should see the ripples spread out in a circular pattern. The tank should be large enough, so this outward moving circular pattern is not obscured by the reflection of the ripples from the side of the tank. Sometimes, a border of foam cushioning is used to minimize side reflections.
- Estimate the wavelength (average distance between ripples) and frequency (number of ripples per second). Estimate the velocity of the ripples. Compare this with the velocity predicted by the wave equation (which applies to all waves): velocity = wavelength × frequency (in cycles per second, which is the same as hertz). If you measure the wavelength in centimeters, the velocity will be in centimeters per second.
- Insert a straight barrier—a wall—in the tank.
- Generate ripples moving toward the barrier at various angles.
- Observe the angle the reflected waves make compared with the incoming waves.