Why aren’t we Saving the Planet: A Psycholotist’s Perspective (15 page)
Read Why aren’t we Saving the Planet: A Psycholotist’s Perspective Online
Authors: Geoffrey Beattie
Tags: #Behavioral Sciences

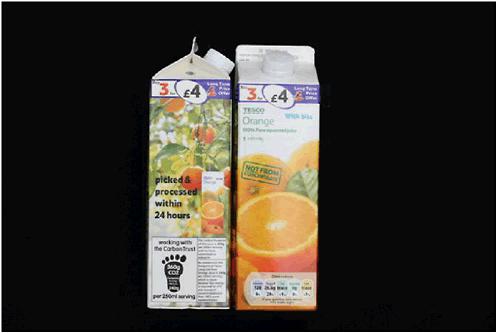
Figure 7.4
Orange juice: view 2.
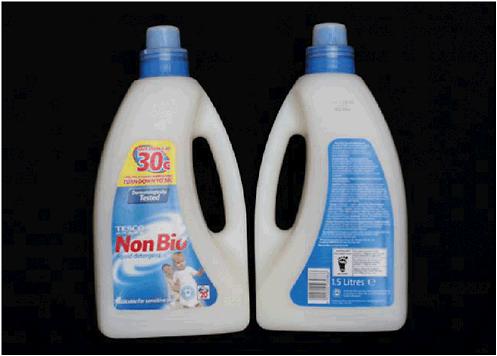
Figure 7.5
Detergent: view 1.
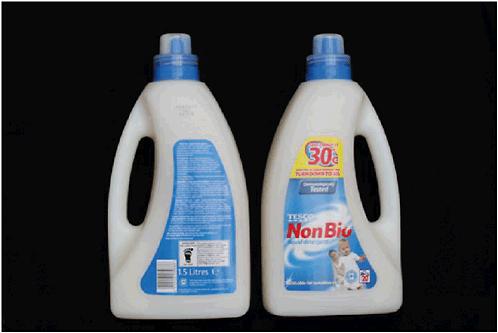
Figure 7.6
Detergent: view 2.
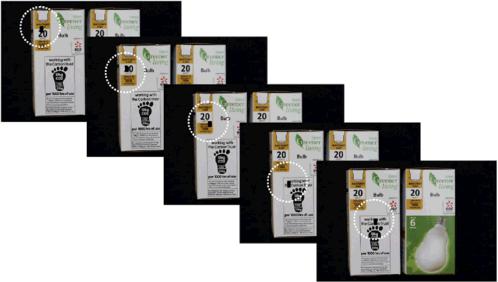
Figure 7.7
Eye tracking example.
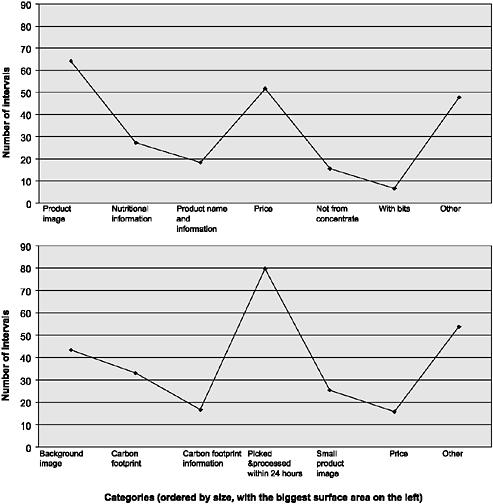
Figure 7.10
Number of (40 ms) intervals with gaze directed at each category, for the first 10 seconds of viewing: (top) orange juice, front; (bottom) orange juice, side.
looking, whereas it increased in the second 5 seconds by a factor of 4. So it looks as if in the case of nutritional information people need longer to get round to reading the textual information about nutritional value, but this pattern of increased focus on relevant textual material does not quite generalise to carbon footprint information.
In the case of the detergent, the main focus of visual attention in the first 10 seconds seemed to be that this detergent can be used at 30° (a mean of 80.8 intervals) followed by the product name (a mean of 62.8 intervals) and the product instructions (57.7 intervals). Of course, the
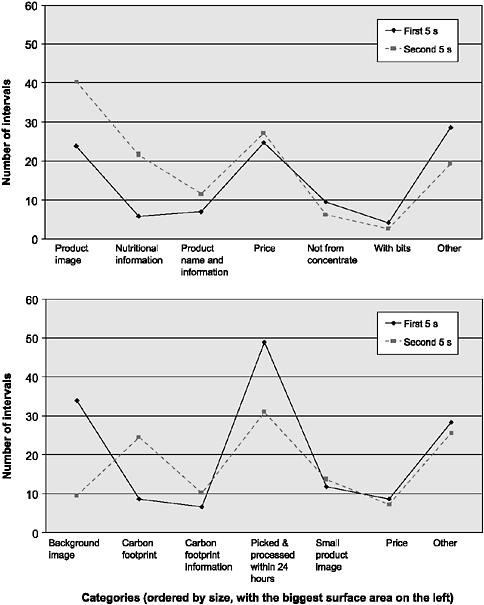
Figure 7.11
Number of (40 ms) intervals with gaze directed at each category, for the first and second 5 seconds of viewing: (top) orange juice, front; (bottom) orange juice, side.
temperature at which you wash clothes is relevant to issues concerning sustainability, but it is not the carbon footprint
per se
that is attended to here. The carbon footprint icon (a mean of 4.6 intervals) was looked at less than the fact that the product was suitable for sensitive skin (a mean of 4.8 intervals) and the information that there was 1.5 litres in
the container (a mean of 5.4 intervals). The accompanying information about carbon footprint was looked at more, but this did not really compete with the main foci of visual attention for the detergent. Interestingly, in the case of the detergent (but not with the other products), there seemed to be a relationship between the surface area of the representation of the information and the proportion of time spent looking at it, as can be seen in
Figure 7.12
.
In terms of the possible differences between the first and second 5 seconds of visual regard, again some interesting differences emerged. The fact that this detergent can be used
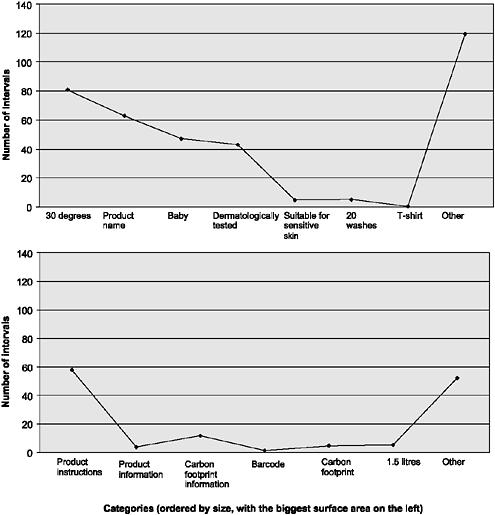
Figure 7.12
Number of (40 ms) intervals with gaze directed at each category, for the first 10 seconds of viewing: (top) detergent, front; (bottom) detergent, back.
at 30° was looked at in the first 5 seconds, but this dropped dramatically in the second 5 seconds. The carbon footprint icon was looked at more in the first than in the second 5 seconds (and indeed hardly at all in the second period – a mean of 20 ms). Similarly, the carbon footprint information was looked at more in the first than in the second 5 seconds, but not necessarily with the kinds of duration that would entail adequate understanding (see
Figure 7.13
).
In the case of all three products, statistical analyses revealed that our experimental participants spent significantly longer looking at information not related to the carbon footprint information (either the carbon footprint icon or the accompanying information) except in three particular cases – the second 5 seconds looking at the light bulb (view 1), the second 5 seconds looking at the light bulb (view 2) and the first 10 seconds looking at the light bulb (view 2). These results clearly show that visual attention to the carbon footprint information was significantly greater in the case of the light bulb than on either of the other products, where there was significantly more attention on the non-carbon footprint information than on the carbon footprint information (see
Table 7.4
).
What has emerged so far is what looks like a clear difference in the pattern of visual attention across the different products (inferred through patterns of statistical significance and non-significance). A number of direct statistical tests were then carried out comparing the proportion of time participants spent looking at either the carbon footprint icon or the carbon footprint information between the various products (keeping each of the product image views separate), as shown in
Table 7.5
.
These statistical analyses revealed a number of significant differences; for example, there was more visual attention to the carbon footprint information on the light bulb in the first 5 seconds than to the carbon footprint on the orange juice (both view 2). Similarly there was more visual attention to the carbon footprint on the light bulb in the first 10 seconds than to the carbon footprint on the orange juice (again view 2). There was also significantly more visual attention to the carbon footprint of the light bulb than to
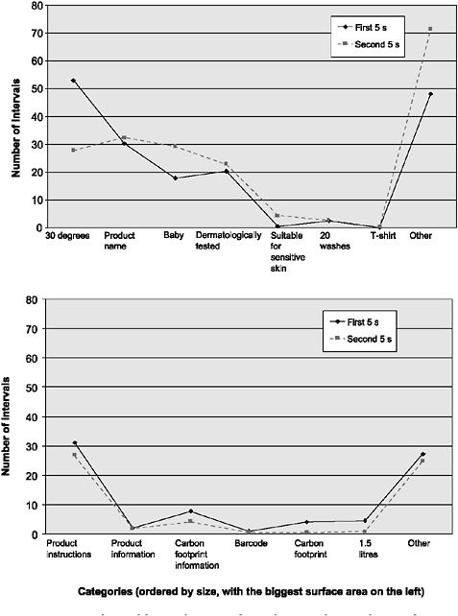
Figure 7.13
Number of (40 ms) intervals with gaze directed at each category, for the first and second 5 seconds of viewing: (top) detergent, front; (bottom) detergent, back.
the carbon footprint of the detergent in each of the six individual comparisons carried out.
In terms of the comparison between the orange juice and the detergent there was significantly more visual attention to the carbon footprint of the orange juice in the second
Table 7.4
Mean number of intervals (40 ms) spent looking at the carbon footprint (icon plus info) and other information (non-CF) for each of the three products
| | CF | Non-CF |
Light bulb view 1 | First 5 seconds | 11.8 | 113.2 |
| Second 5 seconds | 33.7 | 91.3 |
| First 10 seconds | 45.5 | 204.5 |
Light bulb view 2 | First 5 seconds | 36.9 | 88.1 |
| Second 5 seconds | 48.3 | 76.7 |
| First 10 seconds | 85.2 | 164.8 |
Orange juice view 1 | First 5 seconds | 8.8 | 116.2 |
| Second 5 seconds | 26.8 | 98.2 |
| First 10 seconds | 35.6 | 214.4 |
Orange juice view 2 | First 5 seconds | 6.4 | 118.6 |
| Second 5 seconds | 7.8 | 117.2 |
| First 10 seconds | 14.2 | 235.8 |
Detergent view 1 | First 5 seconds | 6.6 | 118.4 |
| Second 5 seconds | 1.0 | 124.0 |
| First 10 seconds | 7.6 | 242.4 |
Detergent view 2 | First 5 seconds | 5.2 | 119.8 |
| Second 5 seconds | 3.6 | 121.4 |
| First 10 seconds | 8.8 | 241.2 |