Understanding Sabermetrics (32 page)
Read Understanding Sabermetrics Online
Authors: Gabriel B. Costa,Michael R. Huber,John T. Saccoma

It looks like Hank Greenberg contributed 7.389 wins to the Tigers in 1934.
Inning 5: The Linear Weights School — Pitching and Defense(1)
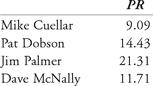
(2)
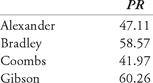
(4)
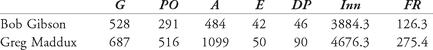
This translates to about 0.29 runs saved per nine innings for Gibson and 0.53 runs saved per nine innings for Maddux.
Hard Slider(2)
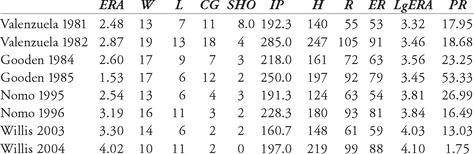
Doc Gooden’s 1985 performance ranks very high on the all-time list. Dontrelle Willis could be classified as having experienced the sophomore jinx. However, he returned to the top the next season (2005), going 22-10, with an ERA over 1.4 runs below the league average.
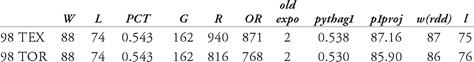
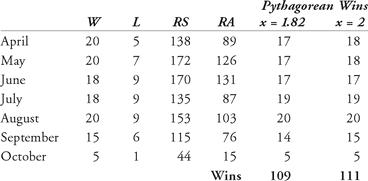
Inning 6: The Runs-Created School(1a)Texas’s projected wins based on the Pythagorean record was 87, while Toronto’s was 86.
(1b)
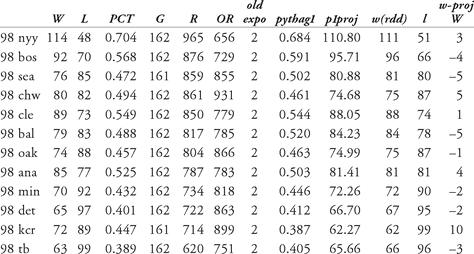
The Kansas City Royals won 10 games more than their projection, and the Seattle Mariners and Baltimore Orioles each won 5 games fewer than their projections.
(2)
We use basic runs created: (H + BB) × (TB) / (AB + BB) = (21276 + 7737)) × (33837) / (78416 + 7737) = 11395 (rounded). The league scored 11365, so the runs-created figure is well within half of 1 percent of the actual figure.
We use basic runs created: (H + BB) × (TB) / (AB + BB) = (21276 + 7737)) × (33837) / (78416 + 7737) = 11395 (rounded). The league scored 11365, so the runs-created figure is well within half of 1 percent of the actual figure.
(3)
Bobby Murcer in 1971:

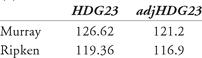
(4)Murray seems to have created more runs, even with the adjustment
(5)
(1)
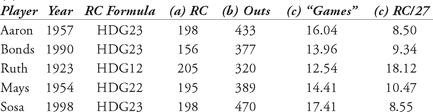
Ruth had almost twice as many runs created per game as the other sluggers.
(2)

Other books
Pure Blood (Time Spirit Trilogy, #3) by Melissa Pearl
An Accidental Murder: An Avram Cohen Mystery by Robert Rosenberg
Been Here All Along by Sandy Hall
Honky Tonk Samurai (Hap and Leonard) by Joe R. Lansdale
Dance of Seduction by Sabrina Jeffries
Day of Vengeance by Johnny O'Brien
L. A. Outlaws by T. Jefferson Parker
Wanted by ML Ross
The White Ghost by James R. Benn
Doctor Illuminatus by Martin Booth