Read The Bell Curve: Intelligence and Class Structure in American Life Online
Authors: Richard J. Herrnstein,Charles A. Murray
Tags: #History, #Science, #General, #Psychology, #Sociology, #Genetics & Genomics, #Life Sciences, #Social Science, #Educational Psychology, #Intelligence Levels - United States, #Nature and Nurture, #United States, #Education, #Political Science, #Intelligence Levels - Social Aspects - United States, #Intellect, #Intelligence Levels
The Bell Curve: Intelligence and Class Structure in American Life (9 page)

A compilation of the studies conducted over the course of the century suggests that the crucial decade was the 1950s. The next figure shows the data for the students in the top quartile (the top 25 percent) in ability and is based on the proportion of students entering college (though not necessarily finishing) in the year following graduation from high school.
Again, the lines highlight trends set in particular periods, here 1925-1950 and 1950-1960. From one period to the next, the proportion of bright students getting to college leaped to new heights. There are two qualifications regarding this figure. First, it is based on high school
graduates—
the only data available over this time period—and therefore drastically understates the magnitude of the real change from the 1920s to the 1960s and thereafter, because so many of the top quartile in ability never made it through high school early in the century (see Chapter 6). It is impossible to be more precise with the available data, but a reasonable estimate is that as of the mid-1920s, only about 15 percent of all of the nation’s youth in the top IQ quartile were going on to college.
4
It is further the case that almost all of those moving on
to college in the 1920s were going to four-year colleges, and this leads to the second qualification to keep in mind: By the 1970s and 1980s, substantial numbers of those shown as continuing to college were going to a junior college, which are on average less demanding than four-year colleges. Interpreting all the available data, it appears that the proportion of all American youth in the top IQ quartile who went directly to four-year colleges rose from roughly one youth in seven in 1925 to about two out of seven in 1950 to more than four out of seven in the early 1960s, where it has remained, with perhaps a shallow upward trend, ever since.
5
At mid’century America abruptly becomes more efficient in getting the top students to college
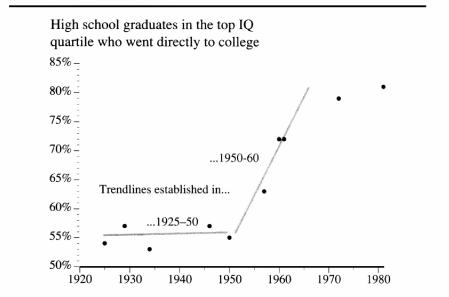
Sources:
Eagle 1988b; Taubman and Wales 1972; authors’ analysis of the National Longitudinal Survey of Youth (NLSY). See below and the introduction to Part II.
But it is not just that the top quartile of talent has been more efficiently tapped for college. At every level of cognitive ability, the links between IQ and the probability of going to college became tighter and more regular. The next figure summarizes three studies that permit us to calculate the probability of going to college throughout the ability range over the last seventy years. Once again we are restricted to high school
graduates for the 1925 data, which overstates the probability of going to college during this period. Even for the fortunate few who got a high school degree in 1925, high cognitive ability improved their chances of getting to college—but not by much.
6
The brightest high school graduates had almost a 60 percent chance of going to college, which means that they had more than a 40 percent chance of not going, despite having graduated from high school and being very bright. The chances of college for someone merely in the 80th percentile in ability were no greater than classmates who were at the 50th percentile, and only slightly greater than classmates in the bottom third of the class.
Between the 1920s and the 1960s, college attendance becomes much more closely pegged to IQ
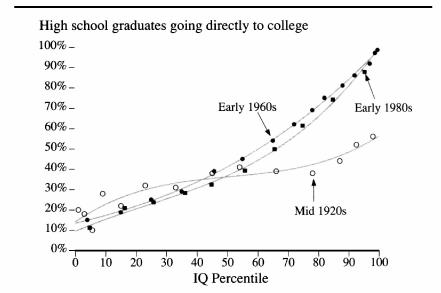
Source:
Taubman and Wales 1972, Figures 3, 4; and authors’ analysis of NLSY students who graduated from high school in 1980-1982.
Between the 1920s and the 1960s, the largest change in the probability of going to college was at the top of the cognitive ability distribution. By 1960, a student who was really smart—at or near the 100th percentile in IQ—had a chance of going to college of nearly 100 percent.
7
Furthermore, as the figure shows, going to college had gotten more dependent on intelligence at the bottom of the distribution, too.
8
A student at the 30th percentile had only about a 25 percent chance of
going to college—
lower
than it had been for high school graduates in the 1920s. But a student in the 80th percentile had a 70 percent chance of going to college, well above the proportion in the 1920s.
The line for the early 1980s is based on students who graduated from high school between 1980 and 1982. The data are taken from the National Longitudinal Survey of Youth (NLSY), which will figure prominently in the chapters ahead. Briefly, the NLSY is a very large (originally 12,686 persons), nationally representative sample of American youths who were aged 14 to 22 in 1979, when the study began, and have been followed ever since. (The NLSY is discussed more fully in the introduction to Part II.) The curve is virtually identical to that from the early 1960s, which is in itself a finding of some significance in the light of the many upheavals that occurred in American education in the 1960s and 1970s.
Didn’t Equal Opportunity in Higher Education Really Open Up During the 1960s?
The conventional wisdom holds that the revolution in higher education occurred in the last half of the 1960s, as part of the changes of the Great Society, especially its affirmative action policies. We note here that the proportion of youths going to college rose about as steeply in the 1950s as in the 1960s, as shown in the opening figure in this chapter and the accompanying discussion. Chapter 19 considers the role played by affirmative action in the changing college population of recent decades.
Meanwhile, the sorting process continued in college. College weeds out many students, disproportionately the least able. The figure below shows the situation as of the 1980s.
9
The line for students entering college reproduces the one shown in the preceding figure. The line for students completing the B.A. shows an even more efficient sorting process. A high proportion of people with poor test scores—more than 20 percent of those in the second decile (between the 10th and 20th centile), for example—entered a two-or four-year college. But fewer than 2 percent of them actually completed a bachelor’s degree. Meanwhile, about 70 percent of the students in the top decile of ability were completing a B.A.
Cognitive sorting continues from the time that students enter college to the time they get a degree

So a variety of forces have combined to ensure that a high proportion of the nation’s most able youths got into the category of college graduates. But the process of defining a cognitive elite through education is not complete. The socially most significant part of the partitioning remains to be described. In the 1950s, American higher education underwent a revolution in the way that sorted the college population itself.
The experience of Harvard with which we began this discussion is a parable for the experience of the nation’s university system. Insofar as many more people now go to college, the college degree has become more democratic during the twentieth century. But as it became democratic, a new elite was developing even more rapidly within the system. From the early 1950s into the mid-1960s, the nation’s university system not only became more efficient in bringing the bright youngsters to college,
it became radically more efficient at sorting the brightest of the bright into a handful of elite colleges.
Prior to World War II, America had a stratum of elite colleges just as it has now, with the Ivy League being the best known. Then as now, these schools attracted the most celebrated faculty, had the best libraries, and sent their graduates on to the best graduate schools and to prestigious jobs. Of these elite schools, Harvard was among the most famous and the most selective. But what was true of Harvard then was true of the other elite schools. They all had a thin layer of the very brightest among their students but also many students who were merely bright and a fair number of students who were mediocre. They tapped only a fragment of the cognitive talent in the country. The valedictorian in Kalamazoo and the Kansas farm girl with an IQ of 140 might not even be going to college at all. If they did, they probably went to the nearest state university or to a private college affiliated with their church.
One of the rare windows on this period is provided by two little-known sources of test score data. The first involves the earliest SATs, which were first administered in 1926. As part of that effort, a standardized intelligence test was also completed by 1,080 of the SAT subjects. In its first annual report, a Commission appointed by the College Entrance Examination Board provided a table for converting the SAT of that era to IQ scores.
10
Combining that information with reports of the mean SAT scores for entrants to schools using the SAT, we are able to approximate the mean IQs of the entering students to the Ivy League and the Seven Sisters, the most prestigious schools in the country at that time.
11
Judging from this information, the entering classes of these schools in 1926 had a mean IQ of about 117, which places the average student at the most selective schools in the country at about the 88th percentile of all the nation’s youths and barely above the 115 level that has often been considered the basic demarcation point for prime college material.
In the same year as these SAT data were collected, the Carnegie Foundation began an ambitious statewide study of high school seniors and their college experience in the entire state of Pennsylvania.
12
By
happy coincidence, the investigators used the same form of the Otis Intelligence Test used by the SAT Commission. Among other tests, they reported means for the sophomore classes at all the colleges and universities in Pennsylvania in 1928. Pennsylvania was (then as now) a large state with a wide variety of public and private schools, small and large, prestigious and pedestrian. The IQ equivalent of the average of all Pennsylvania colleges was 107, which put the average Pennsylvania student at the 68th percentile, considerably below the average of the elite schools. But ten Pennsylvania colleges had freshman classes with mean IQs that put them at the 75th to 90 percentiles.
13
In other words, students going to any of several Pennsylvania colleges were, on average, virtually indistinguishable in cognitive ability from the students in the Ivy League and the Seven Sisters.
Now let us jump to 1964, the first year for which SAT data for a large number of Pennsylvania colleges are available. We repeat the exercise, this time using the SAT-Verbal test as the basis for analysis.
14
Two important changes had occurred since 1928. The average freshman in a Pennsylvania college in 1964 was much smarter than the average Pennsylvania freshman in 1928—at about the 89th percentile. At the same time, however, the elite colleges, using the same fourteen schools represented in the 1928 data, had moved much further out toward the edge, now boasting an average freshman who was at the 99th percentile of the nation’s youth.