The Bell Curve: Intelligence and Class Structure in American Life (46 page)
Read The Bell Curve: Intelligence and Class Structure in American Life Online
Authors: Richard J. Herrnstein,Charles A. Murray
Tags: #History, #Science, #General, #Psychology, #Sociology, #Genetics & Genomics, #Life Sciences, #Social Science, #Educational Psychology, #Intelligence Levels - United States, #Nature and Nurture, #United States, #Education, #Political Science, #Intelligence Levels - Social Aspects - United States, #Intellect, #Intelligence Levels

Where does this leave us? The parties in the debate are often individually confident, and you will find in their articles many flat statements that an overall East Asian-white IQ difference does, or does not, exist. We will continue to hedge. Harold Stevenson and his colleagues have convinced us that matching subjects by socioeconomic status can reduce the difference to near zero, but he has not convinced us that
matching by socioeconomic status is a good idea if one wants to know an estimate of the overall difference between East Asians and whites (we will return to the question of matching by socioeconomic status when we discuss comparisons between blacks and whites). In our judgment, the balance of the evidence supports the proposition that the overall East Asian mean is higher than the white mean. If we had to put a number on it, three IQ points currently most resembles a consensus, tentative though it still is. East Asians have a greater advantage than that in a particular kind of nonverbal intelligence, described later in the chapter.
Jews, Latinos, and Gender
In the text we focus on three major racial-ethnic groupings—whites, East Asians, and blacks—because they have dominated both the research and contentions regarding intelligence. But whenever the subject of group differences in IQ comes up, three other questions are sure to be asked: Are Jews really smarter than everyone else? Where do Latinos fit in, compared to whites and blacks? What about women versus men?
Jews—specifically, Ashkenazi Jews of European origins—test higher than any other ethnic group.
16
The literature indicates that Jews in America and Britain have an overall IQ mean somewhere between a half and a full standard deviation above the mean, with the source of the difference concentrated in the verbal component. In the NLSY, ninety-eight whites with IQ scores identified themselves as Jews. The NLSY did not try to ensure representativeness within ethnic groups other than blacks and Latinos, so we cannot be sure that the ninety-eight Jews in the sample are nationally representative. But it is at least worth noting that their mean IQ was .97 standard deviation above the mean of the rest of the population and .84 standard deviation above the mean of whites who identified themselves as Christian. These tests results are matched by analyses of occupational and scientific attainment by Jews, which consistently show their disproportionate level of success, usually by orders of magnitude, in various inventories of scientific and artistic achievement.
17The term
Latino
embraces people with highly disparate cultural heritages and a wide range of racial stocks. Many of these groups are known to differ markedly in their social and economic profiles. Add to that the problem of possible language difficulties with the tests, and generalizations about IQ become especially imprecise for Latinos. With that in mind, it may be said that their test results generally fall about half to one standard deviation below the national mean. In the NLSY, the disparity with whites was .93 standard deviation. This may be compared to an overall average difference of .84 standard deviation between whites and Mexican-Americans found in the 1960s on the tests used in the famous Coleman report (described in Chapter 17).
18
We will have more to say about the interpretation of Latino scores with regard to possible language bias in Appendix 5. When it comes to gender, the consistent story has been that men and women have nearly identical mean IQs but that men have a broader distribution. In the NLSY, for example, women had a mean on the Armed Forces Qualification Test (AFQT) that was .06 standard deviation lower than the male mean and a standard deviation that was .11 narrower. For the Wechsler Intelligence Scale for Children, the average boy tests 1.8 IQ points higher than the average girl, and boys have a standard deviation that is .8 point larger than girls.
19
The larger variation among men means that there are more men than women at either extreme of the IQ distribution.
If the samples are chosen to be representative of the American population, the answer has been yes for every known test of cognitive ability that meets basic psychometric standards of reliability and validity.
20
The answer is also yes for almost all of the studies in which the black and white samples are matched on some special characteristics—samples of juvenile delinquents, for example, or of graduate students—but there are exceptions. The implication of this effect of selecting the groups to be compared is discussed later in the chapter. Since black-white differences are the ones that strain discourse most severely, we will probe deeply into the evidence and its meaning.
The usual answer to this question is one standard deviation.
21
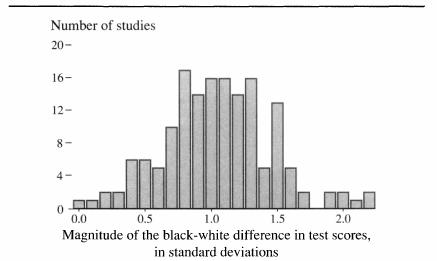
In discussing IQ tests, for example, the black mean is commonly given as 85, the white mean as 100, and the standard deviation as 15. But the differences observed in any given study seldom conform exactly to one standard deviation. The figure below shows the distribution of the black-white difference (subsequently abbreviated as the “B/W difference”) expressed in standard deviations, in the American studies conducted in this century that have reported the IQ means of a black sample and a white sample and meet basic requirements of interpretability as described in the note.
22
A total of 156 studies are represented in the plot, and the mean B/W difference is 1.08 standard deviations, or about sixteen IQ points.
23
The spread of results is substantial, however, reflecting the diversity of the age of the subjects, their geographic location,
their background characteristics, the tests themselves, and sampling error.
Overview of studies of reporting black-white differences in cognitive test scores, 1918-1990

Sources:
Shuey 1966; Osborne and McGurk 1982; Sattler 1988; Vincent 1991; Jensen 1985, 1993b.
When we focus on the studies that meet stricter criteria, the range of values for the B/W difference narrows accordingly. The range of results is considerably reduced, for example, for studies that have taken place since 1940 (after testing’s most formative period), outside the South (where the largest B/W differences are found), with subjects older than age 6 (after scores have become more stable), using full test batteries from one of the major IQ tests, and with standard deviations reported for that specific test administration. Of the forty-five studies meeting these criteria, all but nine of the B/W differences are clustered between .5 and 1.5 standard deviations. The mean difference was 1.06 standard deviations, and all but eight of the thirty-one reported a B/W difference greater than .8 standard deviation.
Still more rigorous selection criteria do not diminish the size of the gap. For example, with tests given outside the South only after 1960, when people were increasingly sensitized to racial issues, the number of studies is reduced to twenty-four, but the mean difference is 1.10 standard deviations. The NLSY, administered in 1980 to by far the largest
sample (6,502 whites, 3,022 blacks) in a national study, found a difference of 1.21 standard deviations on the AFQT.
24
Computing the B/W Difference
The simplest way to compute the B/W difference when limited information is available is to take the two means and to compare them using the standard deviation for the reference population, defined in this case as whites. This is how the differences in the figure on page 277 showing the results of 156 studies were computed. When all the data are available, however, as in the case of the NLSY, a more accurate method is available, which takes into account the standard deviations within each population and the relative size of the samples. The equation is given in the note.
25
Unless otherwise specified, all of the subsequent expressions of the B/W differences are based on this method. (For more about the scoring of IQs in the NLSY, see Appendix 2.)
Answering the question “How large is the difference?” in terms of standard deviations does not convey an intuitive sense of the size of the gap. A rough-and-ready way of thinking about the size of the gap is to recall that one standard deviation above and below the mean cuts off the 84th and 16th percentiles of a normal distribution. In the case of the B/W difference of 1.2 standard deviations found in the NLSY, a person with the black mean was at the 11th percentile of the white distribution, and a person with the white mean was at the 91st percentile of the black distribution.
A difference of this magnitude should be thought of in several different ways, each with its own important implications. Recall first that the American black population numbers more than 30 million people. If the results from the NLSY apply to the total black population as of the 1990s, around 100,000 blacks fall into Class I of our five cognitive classes, with IQs of 125 or higher.
26
One hundred thousand people is a lot of people. It should be no surprise to see (as one does every day) blacks functioning at high levels in every intellectually challenging field.
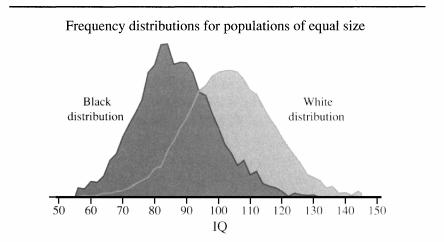
It is important to understand as well that a difference of 1.2 standard deviations means considerable overlap in the cognitive ability distribution for blacks and whites, as shown for the NLSY population in the figure below. For any equal number of blacks and whites, a large proportion
have IQs that can be matched up. This is the distribution to keep in mind whenever thinking about individuals.
The black and white IQ distributions in the NLSY, Version I

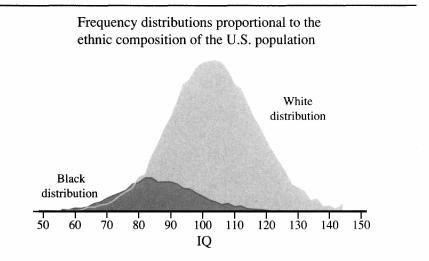
But an additional complication has to be taken into account: In the United States, there are about six whites for every black. This means that the IQ overlap of the two populations as they actually exist in the United States looks very different from the overlap in the figure just above. The next figure presents the same data from the NLSY when the distributions are shown in proportion to the actual population of young people represented in the NLSY. This figure shows why a B/W difference can be problematic to American society as a whole. At the lower end of the IQ range, there are approximately equal numbers of blacks and whites. But throughout the upper half of the range, the disproportions between the number of whites and blacks at any given IQ level are huge. To the extent that the difference represents an authentic difference in cognitive functioning, the social consequences are potentially huge as well. But is the difference authentic?
The black and white IQ distributions in the NLSY, Version II

Appendix 5 contains a discussion of the state of knowledge regarding test bias. Here, we shall quickly review the basic findings regarding blacks, without repeating the citations in Appendix 5, which we urge you to read.