Authors: Colin Barrow
The 30 Day MBA (44 page)

Supply chain channel structures
A channel is a set of businesses that are involved in making a product or service available for use or consumption by a business or another end user. Such businesses may be independent, owned by others in the channel, they may co-exist, compete or collaborate in a wide variety of ways.
The members of a channel carry out some or all of these functions:
- Promotion and contact including advertising, creating awareness and providing contact resources.
- Information on the product or service.
- Matching the product or service to specific customer requirements.
- Risk sharing in elements of the transaction.
- Negotiation in setting the terms of trade and price.
- Financing the cost of the transaction, say by providing credit.
- Manufacturing and/or the physical distribution of the product or execution of the service.
There are four main types of channel.
Conventional
This is when each link in the chain is independent of the other and in effect competes for a slice of the value in getting the end product to the end consumer or user. There are usually four links in the chain (see
Figure 10.4
), however on occasions one link will leap frog over the other.
FIGURE 10.4
 Â
Operating channels
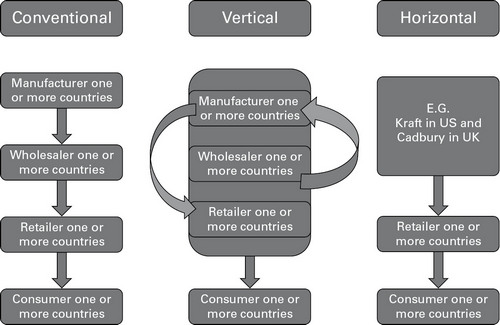
Horizontal marketing systems (HMS)
This occurs where two or more non-competing businesses at one level in the chain combine together to market an existing product, or create a new channel to market because they lack physical or capital resources, an established brand name or to secure economies of scale. The music partnership started by Apple and Starbucks in 2007 is one such example. The aim was to allow Starbucks customers to wirelessly browse, preview, buy and download music from iTunes Music Store onto anything running iTunes. Apple's brand leadership in digital music combined with Starbuck's loyal customer base was expected to create a winâwin situation for both parties. Apple hoped to sell a million songs in the first six months but passed that threshold in six days. Starbucks benefited from higher sales and even stronger customer loyalty.
Vertical marketing systems (VMS)
This strategy integrates producer, wholesalers and retailers working in one unified system. The goal of vertical marketing is to eliminate unnecessary competition between chain participants as occurs, say, when producers and retailers slug it out to get better prices from each other. VMS gives all those involved control but not necessarily ownership. Marks & Spencer, for example, provides considerable amounts of technical assistance to its suppliers, as well as providing detailed sales and stock forecast, but does not own them. VMS itself comes in three forms.
Corporate
This arises when one member of the chain owns some or all of other elements. For example âforward' integration, which arises where a supplier, such as Apple, owns its own retail outlets. âBackward' integration arises when a retailer owns its own suppliers. Coca Cola, who managed to grow its profits by over 50 per cent during a period of near slump conditions thanks to sales in China and India, owns some 400 bottling plants around the world, including one launched in Malaysia in 2011. Spanish clothing
chain Zara, outflanks its competitors such as Gap and Benetton by having control over almost every element of the supply chain from design and production (it makes nearly half of all the fabrics it uses itself) through to worldwide distribution and retailing. Zara can get a new line to market in just one month, some nine times faster than the industry average, which gives it a significant market edge in a fashion dominated industry.
Contractual
This is where independent firms at different levels of the distribution chain agree to co-operate in return for specific advantages. Retail co-operatives are one example of CVMS, where independent retailers band together to increase their buying power, improve their operating systems or to create distinctive brands. The International Co-operative Alliance, the trade body representing this sector, has 230 member organizations from 92 countries active in all sectors of the economy. Japan is home to the No 1 ranked co-op, Zen-Noh, a national federation of agriculture and food cooperatives with revenue of over US $60 billion.
Franchising
Franchising is the most prevalent form of CVMS operating in hundreds of business sectors, servicing both those providing service such as advertising, accounting and web design, as well as products â Ziebart in car protection and the near ubiquitous McDonalds (see case study in
Chapter 1
) A PricewaterhouseCoopers study shows that in the United States alone there are more than 760,000 franchised establishments generating in excess of US $1.5 trillion in economic activity and producing one out of every seven jobs.
Administered
These occur where one or at most a few members dominate the distribution chain and use that position to co-ordinate the other members' activities. Any part of the chain can dominate. Big retailers such as Wal-Mart, Sainsbury's, Toys âR' Us and Carrefour can leverage their strength on manufacturers to such an extent they can make them bid for shelf space. Giant consumer firms with strong brands â Procter & Gamble, Kraft, Coca-Cola, for example, can exert a similar pressure on retailers. Firms away from the fast moving consumer sector such as Sony and Samsung also exert power over the distribution chain. Samsung achieved its strong position by ditching their dozen or so subsidiary brands â Wiseview, Tantus and Yepp, none of which meant much to consumers, to put all its resources behind the Samsung name.
Multiple channels
Major companies almost invariably use several channels to market, most noticeably clicks and bricks firms. There are significant benefits to using
more than one route to market if they deliver superior benefits to a particular market segment and don't erode the brand value. Dorling Kindersley, prior to their acquisition by Pearson PLC, had a part plan operation promoting their books along the lines of Avon and other multi-level marketing companies. Pearson, however, cut out this channel immediately post acquisition as it did not correspond with the image of their high street branding.
Logistics
The goal of an operating logistics system is to manage the whole process of getting products to customers in an efficient and cost-effective manner to meet marketing goals; and to get faulty or unwanted products back. This interfaces with a host of related areas of business including physical transportation, warehousing, relationships with suppliers and inventory and stock management. Some important considerations in logistics include:
- Just in Time (JIT) aims to reduce the need for warehousing through accurate sales forecasting. All parties in the distribution channel carry minimum stock and share information on demand levels.
- Vendor Managed Inventory (VMI) and Continuous Inventory Replenishment Systems (CIRS) requires customers to share real time data on sales demand and inventory levels with suppliers.
Information systems (IS)
If the internet is the external operations powerhouse, IS systems are the mirror image, handling all the data needed to run a 21st-century organization. Every part of a business collects data; production monitors output efficiencies, stock levels and quality; finance gets the accounts, marketing gets figures on customer demand and competitor market share; HR keeps track of pay, training, accidents at work and sickness. But none of this data is much use unless there is an integrated system that can integrate, collate, analyse and disseminate this information in a timely manner and in a format that can be understood and used by operating management.
To be effective, IS needs an appropriate amount of hardware and software, as firms that effectively exploit the power computer information systems can deliver can outperform others. It can play a major role in opening new distribution channels, streamlining supply chains and providing efficient electronic markets. Mainframe/legacy systems, PCs, workstations, intranets and the internet, as well as local area networks (LANs) and wide area networks (WANs), customer relationship management (CRM) and the ubiquitous Moore's Law stating that processing power doubles every 18 months while costs halve, are all vital elements in an MBA's IS vocabulary.
Quantitative and qualitative research and analysis
- Decision-making tools
- Statistical methods
- Making forecasts
- Assessing cause and effect
- Soft studies
- Carrying out surveys
F
inance, marketing, operations and HRM (human resource management) collect an inordinate amount of data and the IT (information technology) department processes it. However, it falls to the application of analysis techniques to interpret the data and explain its significance or otherwise. Bald information on its own is rarely of much use. If staff turnover goes up, customers start complaining and bad debts are on the rise, these facts on their own may tell you very little. Are these figures close to average, or should it be the mean or the weighted average that will reveal their true importance? Even if the figures are bad, you need to know if they are outside the range you might reasonably expect to occur in any event.
Generally, managers prefer to rely on quantitative methods for analysis and there are always plenty of numbers to be obtained. Figures are efficient, easy to manipulate and you should use them whenever you can. But there is also a rich seam of qualitative methods to get valuable information that you cannot obtain well with quantitative methods. These qualitative methods can be used to study human behaviour and more importantly changes in
behaviour. Complex feelings and opinions, such as why employee morale is low, customers are complaining or shareholders dissatisfied, cannot be comprehensively captured by quantitative techniques. Using qualitative methods it is possible to study the variations of complex, human behaviour in context. By connecting quantitative data to behaviour using qualitative methods, a process known as triangulation, you can add an extra dimension to your analysis with people's descriptions, feelings and actions.
In business schools these two methods of analysis are rarely taught together and are even less likely to be taught in the same department, though some marketing professors will manage joined-up analysis in areas such as surveys. At Rotterdam School of Management, Erasmus University (
www.rsm.nl
), for example, in âQuantitative Platform for Business' students investigate the qualitative as well as the quantitative methods available for problem solving within an organization. But EM Lyon (
www.em-lyon.com/en
) confines its teaching to âBusiness Statistics' covering âthe essential quantitative skills that will be required of you throughout the programme'. MIT Sloan School of Management (
http://mitsloan.mit.edu/mba/program/firstsem.php
) has a teaching module, âData, Models, and Decision', in its first semester that âIntroduces students to the basic tools in using data to make informed management decisions'. That seems heavy on quantitative analysis, covering probability, decision analysis, basic statistics, regression, simulation, linear and nonlinear optimization, and discrete optimization, but devoid of much qualitative teaching matter. But MIT does use cases, and examples drawn from marketing, finance, operations management, and other management functions, in teaching this subject.
Quantitative research and analysis
The purpose of quantitative research and analysis is to provide managers with the analytical tools necessary for making better management decisions. The subject, while not rocket science, requires a reasonable grasp of mathematical concepts. It is certainly one area that many attending business school find challenging. But as figures on their own are often of little help in either understanding the underlying facts or choosing between alternatives, some appreciation of probability, forecasting and statistical concepts is essential. It is an area where, with a modicum of application, an MBA can demonstrate skills that will make them stand out from the crowd.
Decision theory
Blaise Pascal (1623â62), the French mathematician and philosopher who with others laid the foundations for the theory of probability, is credited with inaugurating decision theory, or decision making under conditions of uncertainty. Until Pascal's time, the outcomes of events were considered to
be largely in the hands of the gods, but he instigated a method for using mathematical analysis to evaluate the cost and residual value of various alternatives so as to be able to choose the best decision when all the relevant information is not available.
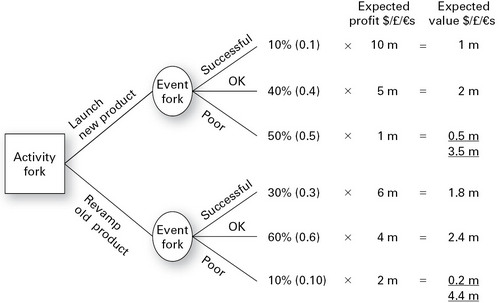
Decision trees
Decision trees are a visual as well as valuable way to organize data so as to help make a choice between several options with different chances of occurring and different results if they do occur. Trees (see
Figure 11.1
) were first used in business in the 1960s but became seriously popular from 1970 onwards when algorithms were devised to generate decision trees and automatically reduce them to a manageable size.
FIGURE 11.1
 Â
Example decision tree
Making a decision tree requires these steps to be carried out initially, from which the diagram can be drawn:
- Establish all the alternatives.
- Estimate the financial consequences of each alternative.
- Assign the risk in terms of uncertainty allied with each alternative.
Figure 11.1
shows an example decision tree. The convention is that squares represent decisions and circles represent uncertain outcomes. In this example, the problem being decided on is whether to launch a new product or revamp an existing one. The uncertain outcomes are whether the result of the decision will be successful ($/£/â¬10 million profit), just ok ($/£/â¬5 million profit)
or poor ($/£/â¬1 million). In the case of launching a new product there is, in the management's best estimate, a 10 per cent (0.1 in decimals) chance of success, a 40 per cent chance it will be ok and a 50 per cent chance it will result in poor sales. Multiplying the expected profit arising from each possible outcome by the probability of its occurring gives what is termed an âexpected value'. Adding up the expected values of all the possible outcomes for each decision suggests, in this case, that revamping an old product will produce the most profit.
The example is a very simple one and in practice decisions are much more complex. We may have intermediate decisions to make, such as should we invest heavily and bring the new product to market quickly, or should we spend money on test marketing. This will introduce more decisions and more uncertain outcomes represented by a growing number of ânodes', the points at which new branches in the tree are formed.
If the outcomes of the decision under consideration are spread over several years, you should combine this analysis with the net present value of the monetary values concerned. (See Discounted Cash Flow in
Chapter 2
, Finance.)
Statistics
Statistics is the set of tools that we use to help us assess the truth or otherwise of something we observe. For example, if the last 10 phone calls a company received were all cancelling orders, does that signal that a business has a problem, or is that event within the bounds of possibility? If it is within the bounds of possibility, what are the odds that we could still be wrong and really have a problem? A further issue is that usually we can't easily examine the entire population, so we have to make inferences from samples and, unless those samples are representative of the population we are interested in and of sufficient size, we could still be very wrong in our interpretation of the evidence. At the time of writing, there was much debate as to how much of a surveillance society Britain had become. The figure of 4.2 million cameras, one for every 14 people, was the accepted statistic. However, a diligent journalist tracked down the evidence to find that extrapolating a survey of a single street in a single town arrived at that figure!
Central tendency
The most common way statistics are considered is around a single figure that purports in some way to be representative of a population at large. There are three principal ways of measuring tendency and these are the most often confused and frequently misrepresented set of numbers in the whole field of statistics.
To analyse anything in statistics you first need a âdata set' such as that in
Table 11.1
.
TABLE 11.1
 Â
The selling prices of companies' products
Product | Selling price $/£/â¬s |
1 | 30 |
2 | 40 |
3 | 10 |
4 | 15 |
5 | 10 |
The mean (or average)
This is the most common tendency measure and is used as a rough and ready check for many types of data. In the example above, adding up the prices â $/£/â¬105 and dividing by the number of products â 5, you arrive at a mean, or average, selling price of $/£/â¬21.
The median
The median is the value occurring at the centre of a data set. Recasting the figures in
Table 11.1
puts product 4's selling price of $/£/â¬15 in that position, with two higher and two lower prices. The median comes into its own in situations where the outlying values in a data set are extreme, as they are in our example, where in fact most of the products sell for well below $/£/â¬21. In this case the median would be a better measure of the central tendency. You should always use the median when the distribution is skewed. You can use either the mean or the median when the population is symmetrical as they will give very similar results.
The mode
The mode is the observation in a data set appearing the most often; in this example it is $/£/â¬10. So if we were surveying a sample of the customers of the company in this example, we would expect more of them to say they were paying $/£/â¬10 for their products, though, as we know, the average price is $/£/â¬21.
Variability
As well as measuring how values cluster around a central value, to make full use of the data set we need to establish how much those values could vary. The two most common methods employed are the following.
Range
The range is calculated as the maximum figure minus the minimum figure. In the example being used here, that is $/£/â¬40â $/£/â¬10 = $/£/â¬30. This figure gives us an idea of how dispersed the data is and so how meaningful, say, the average figure alone might be.
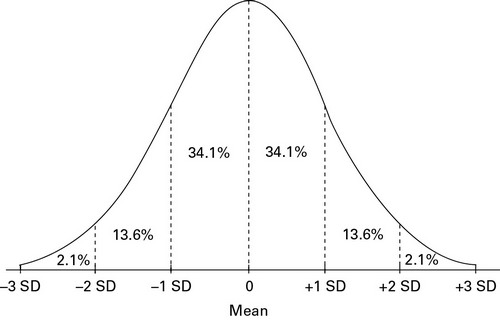
Standard deviation from the mean
This is a rather more complicated concept as you need first to grasp the central limit theorem, which states that the mean of a sample of a large population will approach ânormal' as the sample gets bigger. The most valuable feature here is that even quite small samples are normal. The bell curve, also called the Gaussian distribution, named after Johann Carl Friedrich Gauss (1777â1855), a German mathematician and scientist, shows how far values are distributed around a mean. The distribution, referred to as the standard deviation, is what makes it possible to state how accurate a sample is likely to be. When you hear that the results of opinion polls predicting elections based on samples as small as 1,000 are usually reliable within four percentage points, 19 times out of 20, you have a measure of how important. (You can get free tutorials on this and other aspects of statistics at Web Interface for Statistics Education (
http://wise.cgu.edu
).)
Figure 11.2
is a normal distribution that shows that 68.2 per cent of the observations of a normal population will be found within 1 standard deviation of the mean, 95.4 per cent within 2 standard deviations, and 99.6 per cent within 3 standard deviations. So almost 100 per cent of the observations will be observed in a span of six standard deviations, three below the mean
and three above the mean. The standard deviation is an amount calculated from the values in the sample. Use this calculator (
www.easycalculation.com/statistics/standard-deviation.php
) to work out the standard deviation by entering the numbers in your sample.
FIGURE 11.2
 Â
Normal distribution curve (bell) showing standard deviation