MONEY Master the Game: 7 Simple Steps to Financial Freedom (60 page)
Read MONEY Master the Game: 7 Simple Steps to Financial Freedom Online
Authors: Tony Robbins

TWO DOWN, ONE TO GO
On the surface, asset allocation might sometimes feel complex, even when you understand the principles that Ray has laid out. But there’s one thing I know for sure:
complexity is the enemy of execution.
If you and I are
actually
going to get ourselves to follow through with this process and receive the rewards, I had to find a way to make this advice
even
simpler.
So I said to Ray, “What you have shared with us here is invaluable. A completely different way of looking at asset allocation. By now we all know asset allocation is one of the single most important keys to all successful investing. But the challenge for the average investor—and even for the sophisticated investor—is how to take these principles and translate them into an actual portfolio with the most effective percentages of each asset class. It will be too complex for ninety-nine percent of us to figure out. So it would be a huge gift if you could share the specific percentages that people would invest in each asset class so that their risk would be divided equally among seasons!”
Ray looked at me, and I could see the wheels turning. “Tony, it’s not
really that simple.” Ray explained that in his All Weather strategy, they use very sophisticated investment instruments, and they also use leverage to maximize returns.
I understood where Ray was coming from, so I asked him for a more simplified version: “Can you give me the percentages that the average person can do, without any leverage, to get the best returns with the least amount of risk? I know it’s not going to be your absolute perfect asset allocation because I’m putting you on the spot to create it right here and now. But Ray, your best estimate will certainly be greater than most people’s best plan. Could you give a version of the All Weather portfolio that readers could do on their own or with the help of a fiduciary advisor?”
Ray has taken on very few investors in the last ten years, and the last time he did, you had to be an institutional investor with $5 billion in investable assets, and your initial investment needed to be a minimum of $100 million just to get Ray’s advice. This helps you understand what a big ask I was making. But I know how much he cares about the little guy. He certainly hasn’t forgotten his roots as a self-made man from humble beginnings in Queens, New York.
“Ray, I know you’ve got a huge heart to help, so let’s give folks a recipe for success. You won’t take anybody’s money, even if they are worth five billion dollars today. Help your brothers and sisters out!” I said with a big smile.
And then something magical happened.
I looked in Ray’s eyes, and a smile came across his face. “All right, Tony. It wouldn’t be exact or perfect, but let me give you a sample portfolio that the average person could implement.” And then slowly he began to unfold the exact sequence for what his experience shows will give you and me the increased probability of the highest return in any market environment, as long as we live, with the least amount of risk.
DRUMROLL, PLEASE
You are about to see the exact asset allocation built by a man whom many call the best asset allocator to walk the planet. A self-made man who built himself from nothing financially to a net worth of over $14 billion, and who manages $160 billion a year and produces annual returns of more than
21% for his investors (before fees). Here he shares not only which type of investment but also what percentage of each asset class you need to win! In fact, if you look online, many people have tried to replicate a version of this based upon Ray’s previous interviews. In fact, there is a whole new category of investment products now called “Risk Parity,” based on Ray’s innovations. Many funds or strategies say they were “inspired” by Ray’s approach, but nobody received the specific allocation like Ray provided here. Many of the replicas were down as much as 30% or more in 2008. More like “some weather” than “All Weather,” if you ask me. A fake Rolex will never be a Rolex. (A quick note: the strategy below is
not
the same as Ray’s All Weather strategy, of course. As he said, his fund uses more sophisticated investments and also uses leverage. But the core principles are the same, and the specific percentages are designed directly by Ray, and no one else,
so let’s call this portfolio herein the “All Seasons” portfolio.
)
GIVE ME THE NUMBERS
“So tell me, Ray, what are the percentages you would put in stocks? What percentage in gold? And so on.” He graciously proceeded to sketch out the following breakdown:
First, he said,
we need 30% in stocks (for instance, the S&P 500 or other indexes for further diversification in this basket).
Initially that sounded low to me, but remember, stocks are three times more risky than bonds. And who am I to second-guess the Yoda of asset allocation!?
“Then you need long-term government bonds.
Fifteen percent in intermediate term [seven- to ten-year Treasuries] and forty percent in long-term bonds [20- to 25-year Treasuries].”
“Why such a large percentage?” I asked.
“Because this counters the volatility of the stocks.” I remembered quickly it’s about balancing risk, not the dollar amounts. And by going out to longer-term (duration) bonds, this allocation will bring a potential for higher returns.
He rounded out the portfolio with 7.5% in gold and 7.5% in commodities.
“You need to have a piece of that portfolio that will do well with accelerated inflation, so you would want a percentage in gold and commodities. These have high volatility. Because there are environments where rapid inflation can hurt both stocks and bonds.”
Lastly, the portfolio must be rebalanced. Meaning, when one segment does well, you must sell a portion and reallocate back to the original allocation. This should be done at least annually, and, if done properly, it can actually increase the tax efficiency. This is part of the reason why I recommend having a fiduciary implement and manage this crucial, ongoing process.

GRATITUDE
Wow! There it was in black and white. Ray had masterfully and graciously provided a game-changing recipe that would impact the lives of millions of
Americans. Do you realize the level of generosity this man provided both you and me that wonderful day? Giving from the heart is at the core of who Ray is. Which is why I wasn’t the least bit surprised to learn later that he and his wife, Barbara, have signed the Giving Pledge—a commitment by the world’s wealthiest individuals, from Bill Gates to Warren Buffett, to give away the majority of their wealth through philanthropy.
DO I HAVE YOUR ATTENTION NOW?
When my own investment team showed me the back-tested performance numbers of this All Seasons portfolio, I was astonished. I will never forget it. I was sitting with my wife at dinner and received a text message from my personal advisor, Ajay Gupta, that read, “Did you see the email with the back-tested numbers on the portfolio that Ray Dalio shared with you? Unbelievable!” Ajay normally doesn’t text me at night, so I knew he couldn’t wait to share. As soon as our dinner date was over I grabbed my phone and opened the email . . .
CHAPTER 5.2
IT’S TIME TO THRIVE: STORM-PROOF RETURNS AND UNRIVALED RESULTS
If no mistake have you made, yet losing you are . . . a different game you should play.
—YODA
THE PROOF IS IN THE PUDDING
It’s safe to say that in the past 80-plus years, we have experienced every possible economic season and more than a handful of surprises, from the Great Depression to the Great Recession and everything in between. So how did the All Seasons portfolio perform? As I mentioned, I took it to a team of analysts to have it tested extensively all the way back to 1925! The results astonished everyone.
We already saw in the previous chapter how the All Seasons approach did over 40 years, so let’s dig a little deeper. But
let’s take a look at how it did during what I call the “modern period”—the 30 years from 1984 through 2013. The portfolio was rock solid:
13
•
Just under 10% (precisely 9.72%, net of fees) average annualized return.
(It’s important to note that this is the actual return, not an inflated average return.)
•
You would have made money just over 86% of the time.
That’s only four down/negative years. The average loss was just 1.9%, and one of the four
losses was just 0.03% (essentially a break-even year)—so
effectively you would have lost money only three out of 30 years.
•
The worst down year was –3.93% in 2008 (when the S&P 500 was down 37%!).
• Investor nerd alert! Standard deviation was just 7.63%. (This means extremely low risk and low volatility.)
Why did we select the modern period from 1984? This time frame marks the beginning of the 401(k) plan, when every American became an investor and no longer was the stock market just for the sophisticated. For some perspective, 30 years ago, there was no World Wide Web. Heck, the first “portable” handheld cell phones came out in 1984. The Motorola DynaTac was a beige brick that cost nearly $4,000. The plan itself also cost $50 a month and 50 cents per minute, but you could talk only for 30 minutes before the battery died. I know because I’m ancient enough to be one of the first proud owners.
But let’s not point out just the positives.
Let’s look at how the portfolio held up in the worst times: the economic winters.
This analysis is what the industry calls stress testing.
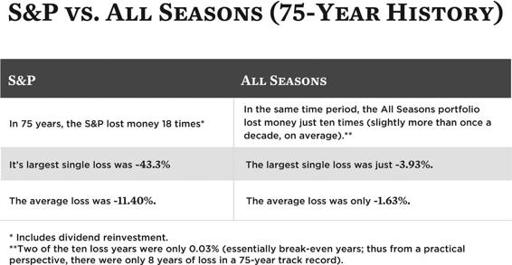
If you look at what I call the “historical period,” from 1939 to 2013 (75 years), consider these startling stats. (Please note that in order to go back further in time, we had to use different “indexes” to represent the asset allocation because certain indexes didn’t exist prior to 1983. See the end of the chapter for a full explanation on the methodology used.)
Let’s go back even further, all the way to 1927, which includes the worst decade in our economic history, the Great Depression:

If a house is deemed storm-proof, the only way to know for sure is to endure the test of time and the worst of storms. Below is a chart showing the seven worst drops since 1935. As you will see, the All Seasons portfolio was actually
up
in two out of seven of those “winters”! And the losses it did sustain were relatively small in comparison with the US stock market. Talk about bucking the trend. While winter was kicking everyone’s butt, this portfolio would have allowed you to spend the winter skiing or snowboarding and enjoying your hot chocolate!
