125 Physics Projects for the Evil Genius (71 page)
Read 125 Physics Projects for the Evil Genius Online
Authors: Jerry Silver

7. Adjust the radiation intensity by changing the distance between the light source and the detector to read about 10 on the intensity scale. You are now calibrated and ready to make some measurements.
8. Measure the current reading and write down the reading on the voltmeter.
9. In several steps, increase the stopping potential and record the current reading at each step. Five readings should be sufficient to define a linear relationship.

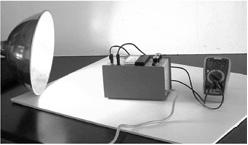
Figure 121-2
Photoelectric effect apparatus
.
10. The data should produce a linear relationship similar to the one shown in
Figure 121-2
between stopping potential and voltage.
11. The voltage required to produce zero current is a key point that determines the value of the work function for the metal (in the photodiode).
12. Repeat the previous steps using the green filter.
13. Replace the fluorescent lamp with a tungsten incandescent lamp. Install the red filter and repeat the previous steps until current versus voltage curves for the red filter.
14. A laser or LED of known wavelength can also be used as a source of illumination. A diverging lens (biconcave) may be helpful in spreading the laser beam to fill the opening area of the photo diode.
15. For each color, plot the current versus voltage and extrapolate the curve to find the threshold stopping voltage that results in zero current.
Expected Results16. Plot the stopping voltage versus the frequency for each of the frequencies (colors) for which you took data.
Ultraviolet light shining on a piece of zinc results in a charge separation. This charge causes the leaves of a negatively charged electroscope to separate further and causes the leaves of a
positively
charged electroscope to come together. This indicates the charge is negative or, more specifically, consisting of electrons. Visible light does
not
result in this charge being developed in the zinc.
Using the photoelectric effect apparatus, we find that:
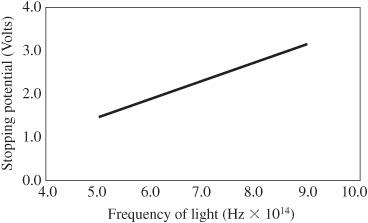
- The greater the frequency, the greater the stopping voltage required to limit the current flow. This relationship is linear. This means the kinetic energy of the freed electrons is proportional to the frequency of the light.
- Below a certain
threshold frequency
, no current is generated. - Increasing the intensity of the light increases the current (for a given stopping potential and light frequency). However, increasing the light intensity does not have any effect on the kinetic energy of the freed electrons.
- The slope of the stopping voltage versus the frequency graph represents Planck’s constant divided by the charge on one electron. The equation for this is:

Because the wavelength of light is usually more readily available, the frequency can be determined from the equation:
frequency = speed of light / wavelength
Why It Works5. From the slope of the voltage versus frequency graph, Planck’s constant can be determined from the slope multiplied by the electronic charge: q = 1.6 × 10
−19
C. A slope of 4 = 10
−5
gives the expected value of Planck’s constant.
Light contains energy based on its frequency. The frequency of visible light is lower than that of ultraviolet light and it does not have enough energy to free electrons from a metal, such as zinc. As the frequency of the light increases, the energy each photon carries is raised above the threshold required to free electrons from the zinc.

Figure 121-3
Stopping potential for electrons exposed to various frequencies of light. The slope of this line determines Planck’s constant
.
The
work function
of a metal is a measure of how tightly electrons are held by the atoms of the metal. If the photon energy is greater than the work function of the metal, electrons are released. If the freed electrons encounter a stopping voltage (stopping potential), the amount of extra energy above the work function can be determined.
This can be summarized by the equation:
KE = E
photon
+ W
where
KE
is the kinetic energy of the freed electron (measured by the amount of voltage required to stop the electrons).
E
photon
is the energy carried by the photon.
W
is the amount of energy just to free one electron from the metal with no extra energy to get it moving.
The energy in a photon was given by:
E
photon
= hf
where
h
is Planck’s constant and
f
is the frequency of the light.
A good software simulation of the results of this experiment can be found at
http://phet-web.colorado.edu/wb-pages/simulations-base.html
.
The key concept underlying this experiment is that light energy comes in specific amounts or packages called
quanta
or
photons
. These photons cannot be broken up into smaller units. The higher the frequency of the light, the greater the amount of energy contained in one photon. If a photon has enough energy to release an electron, an electric current can flow; otherwise, below that threshold, no energy will flow. The more energy the photon has, the more kinetic energy the electron processes when it is released.
Millikan oil-drop experiment. Mystery marbles. Understanding how the experiment worked
.
Robert Millikan devised a brilliant technique to experimentally determine the charge of the electron, which resulted in him being awarded the Nobel Prize for Physics. This project lets you replicate Millikan’s famous experiment. Basically, Millikan found a way to attach electrons to small droplets of oil, and then measure their response to an electric field. Because this is a more complex experiment than most of the other experiments in this book, it may be out of reach for many readers.
For this reason another option to explore this discovery is given. One of the problems Millikan had to deal with was he never knew how many electrons were on any given drop of oil. We can re-create some of the logical steps Millikan followed using pennies to represent electrons.
- film canisters or plastic prescription containers with covers
- spray paint
- about 150 pennies
- digital scale or spring balance
- Millikan’s oil-drop apparatus, as shown in
Figure 122-1
- Spray paint or otherwise obscure the outside of about 8–12 plastic containers, so you can’t see inside.
- Measure the mass of the empty containers.
- Distribute a different (random) number of pennies in each of the containers.
- The easy version of this includes at least one set of containers that differ by one penny (such as Container 7 with 12 pennies and Container 8 with 11 pennies).
- A slightly more challenging version is to have no container differing by one penny, but (because of the small statistical sample) to have at least one set of samples differ by two pennies and another set by two pennies.

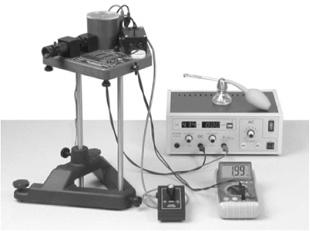
Figure 122-1
Millikan oil drop experiment apparatus. Courtesy PASCO
.
- Find the mass of each container with the pennies.
- Subtract the mass of the container to obtain the mass of just the pennies in each container.
- Arrange the mass measurements in order—smallest to largest.
- Subtract each mass measurement from the previous measurement in the list.
- Identify the smallest (non-zero) mass difference between any pair of containers.
- Divide each of the mass differences by the smallest mass difference in the list.
- If any fractional numbers are in the list, multiply all the number by a factor that leaves only integers in the list. (For instance, if one of the numbers is 1.5, multiply them all by 2.)
- Make a graph of the mass differences on the y-axis versus the integers in Step 7.
- Find the slope of this graph. This should give you the mass of the penny, following a similar form of logic Millikan used to measure the charge of the electron.
- Determine the mass of the oil drop by measuring the velocity of the drop as it falls. Because air resistance affects larger drops to a greater extent, the velocity serves as a very accurate measure of the droplet mass.
- Using X-rays or another source of ionizing radiation, create a random number of charges on the electron.
- Determine the magnitude of the electric field that just balances the gravitational pull on that droplet. The gravitational force can be found from the mass of the droplet determined in Step 1 and the density of oil. The greater the charge, the greater the force needed to balance it.
- At this point, we know the charge, but we don’t know how many electrons are on any given droplet. This is very similar to the situation we just addressed with the pennies. Although we did not know how many pennies were in any particular container, we were able to find the mass of a single penny. Using a similar logic, Millikan was able to find the mass of an electron.