Read The Numbers Behind NUMB3RS Online
Authors: Keith Devlin
The Numbers Behind NUMB3RS (4 page)

Rossmo's formula is a good example of the art of using mathematics to describe incomplete knowledge of real-world phenomena. Unlike the law of gravity, which through careful measurements can be observed to operate
the same way every time
, descriptions of the behavior of individual human beings are at best approximate and uncertain. When Rossmo checked out his formula on past crimes, he had to find the best fit of his formula to those data by choosing different possible values of
f
and
g
, and of B and ?. He then used those findings in analyzing future crime patterns, still allowing for further fine-tuning in each new investigation.
Rossmo's method is definitely not rocket scienceâspace travel depends crucially on always getting the right answer with great accuracy. But it is nevertheless science. It does not work every time, and the answers it gives are probabilities. But in crime detection and other domains involving human behavior, knowing those probabilities can sometimes make all the difference.
2
Fighting Crime with Statistics 101
THE ANGEL OF DEATH
By 1996, Kristen Gilbert, a thirty-three-year-old divorced mother of two sons, ages seven and ten, and a nurse in Ward C at the Veteran's Affairs Medical Center in Northampton, Massachusetts, had built up quite a reputation among her colleagues at the hospital. On several occasions she was the first one to notice that a patient was going into cardiac arrest and to sound a “code blue” to bring the emergency resuscitation team. She always stayed calm, and was competent and efficient in administering to the patient. Sometimes she would give the patient an injection of the heart-stimulant drug epinephrine to attempt to restart the heart before the emergency team arrived, occasionally saving the patient's life in this way. The other nurses had given her the nickname “Angel of Death.”
But that same year, three nurses approached the authorities to express their growing suspicions that something was not quite right. There had been just too many deaths from cardiac arrest in that particular ward, they felt. There had also been several unexplained shortages of epinephrine. The nurses were starting to fear that Gilbert was giving the patients large doses of the drug to bring on the heart attacks in the first place, so that she could play the heroic role of trying to save them. The “Angel of Death” nickname was beginning to sound more apt than they had first intended.
The hospital launched an investigation, but found nothing untoward. In particular, the number of cardiac deaths at the unit was broadly in line with the rates at other VA hospitals, they said. Despite the findings of the initial investigation, however, the staff at the hospital remained suspicious, and eventually a second investigation was begun. This included bringing in a professional statistician, Stephen Gehlbach of the University of Massachusetts, to take a closer look at the unit's cardiac arrest and mortality figures. Largely as a result of Gehlbach's analysis, in 1998 the U.S. Attorney's Office decided to convene a grand jury to hear the evidence against Gilbert.
Part of the evidence was her alleged motivation. In addition to seeking the excitement of the code blue alarm and the resuscitation process, plus the recognition for having struggled valiantly to save the patient, it was suggested that she sought to impress her boyfriend, who also worked at the hospital. Moreover, she had access to the epinephrine. But since no one had seen her administer any fatal injections, the case against her, while suggestive, was purely circumstantial. Although the patients involved were mostly middle-aged men not regarded as potential heart attack victims, it was possible that their attacks had occurred naturally. What tipped the balance, and led to a decision to indict Gilbert for multiple murder, was Gehlbach's statistical analysis.
THE SCIENCE OF STATE
Statistics is widely used in law enforcement in many ways and for many purposes. In
NUMB3RS
, Charlie often carries out a statistical analysis, and the use of statistical techniques will appear in many chapters in this book, often without our making explicit mention of the fact. But what exactly does statistics entail? And why was the word in the singular in that last sentence?
The word “statistics” comes from the Latin term
statisticum collegium
, meaning “council of state” and the Italian word
statista
, meaning “statesman,” which reflects the initial uses of the technique. The German word
Statistik
likewise originally meant the analysis of data about the state. Until the nineteenth century, the equivalent English term was “political arithmetic,” after which the word “statistics” was introduced to refer to any collection and classification of data.
Today, “statistics” really has two connected meanings. The first is the collection and tabulation of data; the second is the use of mathematical and other methods to draw meaningful and useful conclusions from tabulated data. Some statisticians refer to the former activity as “little-s statistics” and the latter activity as “big-S Statistics”. Spelled with a lower-case s, the word is treated as plural when it refers to a collection of numbers. But it is singular when used to refer to the activity of collecting and tabulating those numbers. “Statistics” (with a capital S) refers to an activity, and hence is singular.
Though many sports fans and other kinds of people enjoy collecting and tabulating numerical data, the real value of little-s statistics is to provide the data for big-S Statistics. Many of the mathematical techniques used in big-S Statistics involve the branch of mathematics known as probability theory, which began in the sixteenth and seventeenth centuries as an attempt to understand the likely outcomes of games of chance, in order to increase the likelihood of winning. But whereas probability theory is a definite branch of mathematics, Statistics is essentially an applied science that uses mathematical methods.
While the law enforcement profession collects a large quantity of little-s statistics, it is the use of big-S Statistics as a tool in fighting crime that we shall focus on. (From now on we shall drop the “big S”, “little s” terminology and use the word “statistics” the way statisticians do, to mean both, leaving the reader to determine the intended meaning from the context.)
Although some applications of statistics in law enforcement use sophisticated methods, the basic techniques covered in a first-semester college statistics course are often enough to crack a case.
This was certainly true for
United States v. Kristen Gilbert
. In that case, a crucial question for the grand jury was whether there were significantly more deaths in the unit when Kristen Gilbert was on duty than at other times. The key word here is “significantly”. One or two extra deaths on her watch could be coincidence. How many deaths would it take to reach the level of “significance” sufficient to indict Gilbert? This is a question that only statistics can answer. Accordingly, Stephen Gehlbach was asked to provide the grand jury with a summary of his findings.
HYPOTHESIS TESTING
Gehlbach's testimony was based on a fundamental statistical technique known as hypothesis testing. This method uses probability theory to determine whether an observed outcome is so unusual that it is highly unlikely to have occurred naturally.
One of the first things Gehlbach did was plot the annual number of deaths at the hospital from 1988 through 1997, broken down by shiftsâmidnight to 8:00
AM
, 8:00
AM
to 4:00
PM
, and 4:00
PM
to midnight. The resulting graph is shown in figure 1. Each vertical bar shows the total number of deaths in the year during that particular shift.
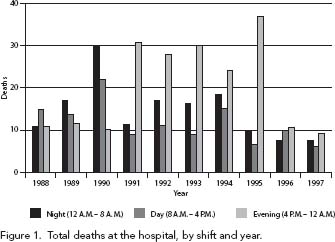
The graph shows a definite pattern. For the first two years, there were around ten deaths per year on each shift. Then, for each of the years 1990 through 1995, one of the three shifts shows between 25 and 35 deaths per year. finally, for the last two years, the figures drop back to roughly ten deaths on each of the three shifts. When the investigators examined Kristen Gilbert's work record, they discovered that she started work in Ward C in March 1990 and stopped working at the hospital in February 1996. Moreover, for each of the years she worked at the VA, the shift that showed the dramatically increased number of deaths was the one she worked. To a layperson, this might suggest that Gilbert was clearly responsible for the deaths, but on its own it would not be sufficient to secure a convictionâindeed, it might not be enough to justify even an indictment. The problem is that it may be just a coincidence. The job of the statistician in this situation is to determine just how unlikely such a coincidence would be. If the answer is that the likelihood of such a coincidence is, say, 1 in 100, then Gilbert might well be innocent; and even 1 in 1,000 leaves some doubt as to her guilt; but with a likelihood of, say, 1 in 100,000, most people would find the evidence against her to be pretty compelling.
To see how hypothesis testing works, let's start with the simple example of tossing a coin. If the coin is perfectly balanced (i.e., unbiased or fair), then the probability of getting heads is 0.5.
*
Suppose we toss the coin ten times in a row to see if it is biased in favor of heads. Then we can get a range of different outcomes, and it is possible to compute the likelihood of different results. For example, the probability of getting at least six heads is about 0.38. (The calculation is straightforward but a bit intricate, because there are many possible ways you can get six or more heads in ten tosses, and you have to take account of all of them.) The figure of 0.38 puts a precise numerical value on the fact that, on an intuitive level, we would not be surprised if ten coin tosses gave six or more heads. For at least seven heads, the probability works out at 0.17, a figure that corresponds to our intuition that seven or more heads is somewhat unusual but certainly not a cause for suspicion that the coin was biased. What would surprise us is nine or ten heads, and for that the probability works out at about 0.01, or 1 in 100. The probability of getting ten heads is about 0.001, or 1 in 1,000, and if that happened we would definitely suspect an unfair coin. Thus, by tossing the coin ten times, we can form a reliable, precise judgment, based on mathematics, of the hypothesis that the coin is unbiased.
In the case of the suspicious deaths at the Veteran's Affairs Medical Center, the investigators wanted to know if the number of deaths that occurred when Kristen Gilbert was on duty was so unlikely that it could not be merely happenstance. The math is a bit more complicated than for the coin tossing, but the idea is the same. Table 1 gives the data the investigators had at their disposal. It gives numbers of shifts, classified in different ways, and covers the eighteen-month period ending in February 1996, the month when the three nurses told their supervisor of their concerns, shortly after which Gilbert took a medical leave.
Table 1. The data for the statistical analysis in the Gilbert case.
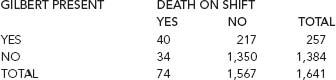
Altogether, there were 74 deaths, spread over a total of 1,641 shifts. If the deaths are assumed to have occurred randomly, these figures suggest that the probability of a death on any one shift is about 74 out of 1,641, or 0.045. Focusing now on the shifts when Gilbert was on duty, there were 257 of them. If Gilbert was not killing any of the patients, we would expect there to be around 0.045 Ã 257 = 11.6 deaths on her shifts, i.e., around 11 or 12 deaths. In fact there were moreâ40 to be precise. How likely is this? Using mathematical methods similar to those for the coin tosses, statistician Gehlbach calculated that the probability of having 40 or more of the 74 deaths occur on Gilbert's shifts was less than 1 in 100 million. In other words, it is unlikely in the extreme that Gilbert's shifts were merely “unlucky” for the patients.
The grand jury decided there was sufficient evidence to indict Gilbertâpresumably the statistical analysis was the most compelling evidence, but we cannot know for sure, as a grand jury's deliberations are not public knowledge. She was accused of four specific murders and three attempted murders. Because the VA is a federal facility, the trial would be in a federal court rather than a state court, and subject to federal laws. A significant consequence of this fact for Gilbert was that although Massachusetts does not have a death penalty, federal law does, and that is what the prosecutor asked for.
STATISTICS IN THE COURTROOM?
An interesting feature of this case is that the federal trial judge ruled in pretrial deliberations that the statistical evidence should not be presented in court. In making his ruling, the judge took note of a submission by a second statistician brought into the case, George Cobb of Mount Holyoke College.