Read The Bell Curve: Intelligence and Class Structure in American Life Online
Authors: Richard J. Herrnstein,Charles A. Murray
Tags: #History, #Science, #General, #Psychology, #Sociology, #Genetics & Genomics, #Life Sciences, #Social Science, #Educational Psychology, #Intelligence Levels - United States, #Nature and Nurture, #United States, #Education, #Political Science, #Intelligence Levels - Social Aspects - United States, #Intellect, #Intelligence Levels
The Bell Curve: Intelligence and Class Structure in American Life (81 page)

In short, federal antidiscrimination efforts writ large—embracing all the disparate events following on the rise of the civil rights movement in the mid-1950s—probably had a significant impact on black economic progress. Job discrimination law in particular probably had a smaller but significant effect for some blacks in some settings. No serious student of
the topic argues that job discrimination law had the decisive impact that is commonly attributed to it in political rhetoric.
We now pose a question of affirmative action that has not been asked in the literature we just reviewed: How do the observed differences between blacks and whites in occupations and wages compare to those that would be predicted from the observed black-white difference in the distribution of cognitive ability? We presented the summary answer as of the end of the 1980s in Chapter 14, when we showed that, after controlling for IQ, a higher proportion of blacks than whites in the NLSY are in the professions and that wages for blacks and whites are essentially equal. Neither education nor socioeconomic background, accounted as well as IQ for the differences in jobs or wages between blacks and whites.
These findings may bear on the question of the impact of affirmative action in the workplace. To see why, let us examine the mean IQs for NLSY members in different job categories as of 1990, as shown in the table below. In all job categories, from highest to lowest in skill, employers are hiring blacks who differ from whites in those jobs by one or more standard deviations in IQ. Part of the reason may be that employers hire blacks and whites of differing cognitive ability because of the pressures brought on them by government policies regarding the representation of minority groups. Without such pressures and in a raceblind labor market, blacks and whites should be equal in those traits that best predict performance on the job. From the kinds of data reviewed in Chapter 3, we know that cognitive ability is such a trait—the more so, the greater the skills are involved in the job. Consequently, we should expect the IQ gap between whites and blacks to be the narrowest for high-skill jobs if hiring is race blind.
| The Black-White IQ Difference by Job Category, 1990 | ||
|---|---|---|
| Job Category | Mean White IQ | Black-White Difference, in Standard Deviations |
| Professions | 114 | 1.3 |
| Managerial | 108 | 1.1 |
| Technical | 113 | 1.5 |
| Sales | 106 | 1.4 |
| Clerical | 104 | 1.1 |
| Protective services | 103 | 1.4 |
| Other service jobs | 97 | 1.4 |
| Craft | 99 | 1.1 |
| Low-skill labor | 96 | 1.1 |
We may draw this conclusion without knowing whether an employer administers cognitive tests to job candidates or even thinks consciously about cognitive ability when hiring. The relationship of cognitive ability to job productivity exists independent of the existence of test scores, and all hiring practices that succeed in choosing productive workers will tend to select employees with only small group differences in intelligence for occupations in which IQ is most important. The table above shows no such narrowing for the cognitively demanding jobs. If anything the gap widens toward the top of the table.
The most plausible explanation for the large gap toward the top of the table is that employers are using dual standards for black and white job applicants. Moreover, we venture the hypothesis that employers are using dual standards at least in part because someone or something (the government or an aversion to harmful publicity) is making them do so—hence our conclusion that affirmative action is probably having a more substantial impact on hiring practices than the standard analyses indicate.
This also leads to a reinterpretation of the graph on page 485 for clerical and professional and technical jobs. We pointed out that the trendlines for black employees did not get steeper, with the single exception of clerical jobs, after the Civil Rights Act was passed. Now we are suggesting an alternative perspective: The fact that the trendlines continued to go up as long as they did is in itself evidence of the impact of affirmative action. Without affirmative action, the trendlines would have leveled off sooner, perhaps at the point at which blacks and whites of equal IQ had equal chances of employment in high-status jobs. In the next figure, we adjust the hiring proportions for the known difference in IQ between whites and blacks.
11
For professional and technical jobs, the assumption is that employees are normally drawn from people with
IQs of 98 or higher; for clerical jobs, the assumption is that they are drawn from within the range of 86 to 123.
12
The results are shown in the figure below.
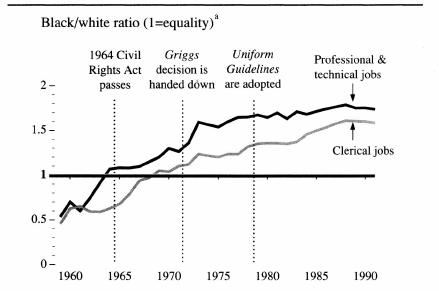
A revised view of equal employment opportunity after correcting for ethnic differences in the IQ distributions
Source:
Bureau of Labor Statistics 1983, 1989; U.S. Department of Labor 1991.
a The ratio represents blacks employed in a given occupational grouping expressed as a percentage of eligible blacks, divided by the whites employed in the same occupational grouping expressed as a percentage of eligible whites. The number of eligibles is determined by the size of the working-age population in that race who fall within the IQ range for that occupation, as calculated from a table of normal probabilities. The assumptions for computing the ratio are: (1) the IQ range for professional and technical jobs is 98 and higher; (2) the IQ range for clerical jobs is 86-123; (3) IQ is normally distributed with a mean of 85 for blacks and 1OO for nonblacks, with a standard deviation of 15 for both groups.
What “should” the lines look like? If the assumptions in drawing them were accurate, then both lines should have risen to 1 (to signify that blacks and whites in the same IQ range are hired at the same rate) after the antidiscrimination laws were passed and then hovered near 1 thereafter. Anything above 1.0 signifies a higher likelihood for blacks
of being hired, once IQ is held constant; below 1.0, the opposite is true. The proportion of blacks in professional and technical jobs rose above 1 in the early 1960s, flattened after the Civil Rights Act of 1964, took another steep jump after
Griggs,
and then settled into a gradual rise through the late 1980s. For clerical jobs, progress after 1964 led to parity in the late 1960s. The relative proportion of blacks in clerical jobs then continued to increase at a slower but more nearly linear pace since then. In both categories of employment, blacks have been hired at higher rates than whites of equal IQ since the late 1960s, and the upward trend lasted at least until the late 1980s.
Since these job categories do not have precisely defined IQ ranges, it may be asked what would happen if the assumptions were changed. Some of the alternatives we tried are described in the note to this paragraph. The short answer is that the picture stays essentially the same within any reasonable range of assumptions. The overall conclusion is that blacks have for some years had more people working in both clerical jobs and professional and technical jobs than would ordinarily be expected, given the IQ range from which those jobs are usually filled.
13
The figure above uses broad guidelines about the IQ range from which certain jobs are held and applies them to national data about occupations. For a narrower focus, the NLSY supplies data about specific individuals, their occupations, and IQs.
14
In 1990, using the same definition of “professional and technical occupations,” and after controlling for IQ (set at 113, the mean IQ for whites in such occupations), the proportion of blacks in the NLSY employed in professional and technical occupations was 1.5 times the proportion for whites, compared to the ratio of 1.7 shown for 1990 in the graph. For clerical jobs, after controlling for age and IQ (with IQ set at 103, the mean value for whites holding clerical jobs), a black in the NLSY was 1.9 times more likely than a white to be employed in a clerical job, compared to the figure of 1.6 for 1990 as shown in the graph.
15
The conclusion drawn from national statistics is thus confirmed by the individual data in the NLSY.
Several points may be drawn from this exercise. First, it highlights the reality and magnitude of the discrimination suffered by blacks prior to the civil rights movement. As recently as 1959, the employment of blacks in clerical and professional and technical jobs was only half the proportion that would have been expected from recruitment to those jobs based on IQ alone. Decennial census data (not to mention living
memory) tell us that this underrepresentation was still more severe in the 1950s and 1940s.
16
There was a clear and large racial deficit to be made up.
Second, the exercise shows how rapidly changes were made in the 1960s and early 1970s. If cognitive ability is taken into account, the underrepresentation of blacks in professional and technical jobs was gone by 1964, prior to the Civil Rights Act. This closing of the occupational gap between blacks and whites, obscured by trendlines that do not compensate for IQ differences, argues that something besides antidiscrimination legislation was already afoot in America, making the job market less stacked against blacks.
Third, by the end of the 1960s, the job market had pressed beyond the point of parity for blacks and whites, again after cognitive ability is taken into account. One might argue that this merely proves that IQ is not so important for job productivity after all—except that a large literature, already summarized, demonstrates beyond much doubt that IQ is as predictive of job performance for blacks as for whites.
17
We can only surmise that the reason for attaining such high levels of black representation, particularly in the occupations that most strongly correlate with IQ, includes the impact of affirmative action policies. To that extent, if these affirmative action policies were changed, black employment in these occupations would fall. Would this be a return to unfairness? We will return to this hard question after considering the costs of affirmative action for job performance.
Inasmuch as cognitive ability is related to job performance and as minority workers are entering professions with lower ability distributions than whites, is there evidence of lower average performance for minority workers than for whites? Of all the many kinds of double-speak associated with affirmative action, this question points to one of the most egregious. Private complaints about the incompetent affirmative-action hiree are much more common than scholarly examination of the issue. We may nonetheless present several cases bearing on job performance, all telling similar stories for different occupations, using different kinds of data.
The nationwide enthusiasm for teacher competency examinations in the 1980s resulted in teacher testing programs in virtually all states by the end of the decade.
18
These competency tests are seldom job performance tests as such, but rather a test of basic knowledge of reading, writing, and mathematics. Even so, teachers who score higher on the tests have greater success with their students.
19
The competency exams seem to have had some generally beneficial effects, though the cutoffs are low by the usual standards of what we expect teachers to know.
20
The pass rates for whites typically exceed 80 percent and sometimes 90 percent. Whatever your profession may be, think about the meaning of a test that would “pass” aspirants to the profession who perform in the bottom 20 percent. But having so low a cutoff for whites sharpens the evidence of the disparity in black and white qualifications, as shown in the following
table
.
| Typical Results of State Teacher Competency Examinations | |||
|---|---|---|---|
| | Pass Rate | ||
| | Whites | Blacks | Implied Difference in SDsa |
| Sources: H. Collins, “Minority groups are still lagging on teacher exam,” Philadelphia Inquirer, Aug. 5, 1989, p. B1; T. Spofford, “Teacher test called biased,” Albany Times Union, Nov. 20, 1987, p. A1; B. Davila, “State’s teacher test biased against minorities, lawsuit contends,” Sacramento Bee, Sept. 24, 1992, p. B8; “Minority teachers,” Richmond News Leader, May 16, 1989, p. A14. | |||
| aAssumes a normal distribution and equal standard deviations in both groups. | |||
| California, 1983-1991 | 80% | 35% | 1.2 |
| Pennsylvania, 1989 | 93 | 68 | 1.0 |
| New York, 1987 | 83 | 36 | 1.3 |
| Georgia, 1978-1986 | 87 | 40 | 1.4 |