The Bell Curve: Intelligence and Class Structure in American Life (116 page)
Read The Bell Curve: Intelligence and Class Structure in American Life Online
Authors: Richard J. Herrnstein,Charles A. Murray
Tags: #History, #Science, #General, #Psychology, #Sociology, #Genetics & Genomics, #Life Sciences, #Social Science, #Educational Psychology, #Intelligence Levels - United States, #Nature and Nurture, #United States, #Education, #Political Science, #Intelligence Levels - Social Aspects - United States, #Intellect, #Intelligence Levels

33
We have defined these as the first twelve of the listed universities in the
U.S. News & World Report
listing for 1990. They are (in the order of their ranking) Harvard, Stanford, Yale, Princeton, Cal Tech, MIT, Duke, Dartmouth, Cornell, Columbia, University of Chicago, and Brown.
34
The probabilities are based on the proportions of people entering these categories in the 1980s, which means that they become progressively too generous for older readers (when the proportion of people getting college degrees was smaller). But this is a technicality; the odds are already so tiny that they are for practical purposes unaffected by further restrictions. The figure for college degrees reflects the final educational attainment of members of the NLSY, who were born in 1957 through 1964, as of 1990 (when the youngest was 25), as a weighted proportion of the NLSY population. The figure for Ph.D., law, and medical degrees is based on the number of degrees awarded over 1980-1989 expressed as a proportion of the population age 26 in each of those years. The figure for graduates of the dozen elite schools is based on the number of undergraduate degrees awarded by
these institutions in 1989 (the figure has varied little for many years), expressed as a proportion of the population age 22 in 1989 (incidentally, the smallest cohort since the mid-1970s.)
35
Based on the median percentages for those score intervals among those schools.
1
Herrnstein 1973.
2
For a one-source discussion of IQs and occupations, see Matarazzo 1972, chap. 7. Also see Jencks et al. 1972 and Sewell and Hauser 1975 for comprehensive analyses of particular sets of data. The literature is large and extends back to the early part of the century. For earlier studies, see, for example, Bingham 1937; Clark and Gist 1938; Fryer 1922; Pond 1933; Stewart 1947; Terman 1942. For more recent estimates of minimum scores for a wide variety of occupations, see E. F Wonderlic & Associates 1983; U.S. Department of Labor 1970.
3
Jencks et al. 1972.
4
Fallows 1985.
5
The Fels Longitudinal Study; see McCall 1977.
6
The correlation was a sizable .5-.6, on a scale that goes from −1 to +1. See Chapter 3 and Appendix 1 for a fuller explanation of what the correlation coefficient means. Job status for the boys was about equally well predicted by childhood IQ as by their completed educational levels; for the girls, job status was
more
correlated with childhood IQ than with educational attainment. In another study, adult intelligence was also more, highly correlated with occupational status than with educational attainment (see Duncan 1968). But this may make a somewhat different point, inasmuch as adult intelligence may itself be affected by educational attainment, in contrast to the IQ one chalks up at age 7 or 8 years. In yet another study, based on Swedish data, adult income (as distinguished from occupational status) was less strongly dependent on childhood IQ (age 10) than on eventual educational attainment (T. Husén’s data presented in Griliches 1970), although being strongly dependent on both. Other analyses come up with different assessments of the underlying relationships (e.g., Bowles and Gintis 1976; Jencks 1979). Not surprisingly, the empirical picture, being extremely diverse and rich, has lent itself to myriad formal analyses, which we will make no attempt to review. In Chapters 3 and 4, we present our interpretation of the link between individual ability and occupation. We also discuss some of the evident exceptions to these findings.
7
Many of the major studies (e.g., Duncan 1968; Jencks et al. 1972; McCall 1977; Sewell and Hauser 1975) include variables describing familial socioeconomic
status, which prove to be somewhat predictive of a person’s own status.
8
For a fuller discussion of both the explanation and the controversy, see Herrnstein 1973.
9
Teasdale, Sorenson, and Owen 1984.
10
The authors of the study offered as an explanation for this pattern of results the well-established pattern of resemblances among relatives in IQ, presumably owing to the genes that natural siblings share and that adoptive siblings do not share. It could, of course, be traits of personality rather than of intellect that tie a family’s occupational destinies together. However, the small body of evidence bearing on personality traits finds them to be distinctly weaker predictors of job status than is IQ. Another study, of over 1,000 pairs of Norwegian twins, supported the conclusion that the resemblance in job status among close relatives is largely explained by their similarity in IQ and that genes play a significant role in this similarity. See Tambs et al. 1989.
11
For some of the most detailed distributional data, see Stewart 1947, Table 1.
12
Matarazzo 1972, p. 177.
13
Specific cognitive strengths also vary by occupation, with engineers tending to score higher on analytic and quantitative sections of the Graduate Record Exams, while English professors do better on the verbal portions (e.g., Wah and Robinson 1990, Figure 2.2).
14
With a mean of 100 and SD of 15, an IQ score of 120 cuts off the 91st percentile of a normal distribution. But the IQ distribution tends to be skewed so that it is fat on the right tail. To say that 120 cuts off the top tenth is only approximate but close enough for our purposes.
15
The procedure we used to create the figure on page 56 yielded an estimate of 23.2 percent of the top IQ decile in high-IQ occupations in 1990. Of the top IQ decile in the NLSY as of 1990, when they ranged in age from 25 to 32, 22.2 percent of the top decile were employed in the dozen high-IQ occupations. The analysis excludes those who were still enrolled in school in 1990 and those who were in the military (because their occupation within the military was unknown). The NLSY figure is an underestimate (compared to the national estimate) in that those who are still students will disproportionately enter high-IQ professions. On the other hand, the NLSY would be likely to exceed the national data in the figure insofar as the entire NLSY age cohort is of working age, without retirees. One other comment on possible distortions over time: It might be hypothesized that, since 1900, the mean has dropped and distribution has spread, as more and more people have entered those professions. The plausibility of the hypothesis is arguable; indeed, there are reasons for hypothesizing
that the opposite has occurred (for the same reasons educational stratification has raised the IQ of students at the elite colleges). But it would not materially affect the plot in the figure on page 56 even if true, because the numbers of people in those professions were so small in the early decades of the century. It may also be noted that in the NLSY data, 46 percent of all job slots in the high-IQ occupations were held by people in the top decile, again matching our conjecture about the IQ scores within the occupations.
16
Terman and Oden 1947.
17
The NLSY cannot answer that question, because even a sample of 11,878 (the number that took the AFQT) is too small to yield adequate sample sizes for analyzing subgroups in the top tenth of the top percentile.
18
There are not that many people with IQs of 120+ left over, after the known concentrations of them in the high IQ occupations are taken into account.
19
The literature is extensive. The studies used for this discussion, in addition to those cited specifically, include Bendix 1949; Macmahon and Millett 1939; Pierson 1969; Stanley, Mann, and Doig 1967; Sturdivant and Adler 1976; Vanee 1966; Warner and Abegglen 1955.
20
Newcomer 1955, Table 24, p. 68.
21
Clews 1908, pp. 27, 37, quoted in Newcomer 1955, p. 66.
22
The data are drawn from Newcomer 1955.
23
Burck 1976. The
Fortune
survey was designed to yield data comparable with those in Newcomer 1955.
24
The ostensible decline in college degrees after 1950 is explained by college graduates’ going on to get additional educational credentials. For another study of educational attainment of CEOs that shows the same pattern, see Priest 1982.
25
U.S. Bureau of the Census 1992, Tables 18, 615, and U.S. Department of Labor 1991, Table 22.
26
Excluding accountants, who were already counted in the high-IQ professions.
27
Matarazzo 1972, Table 7.3, p. 178.
1
Bok 1985b. In another setting, again discussing the SAT, he wrote, “Such tests are only modestly correlated with subsequent academic success and give no reliable indication of achievement in later life” (Bok 1985a, p. 15).
2
The correlation of IQ with income in a restricted population such as Harvard graduates could be negative when people toward the top of the IQ distribution are disproportionately drawn into academia, where they make
a decent living but seldom much more than that, while students with IQs of “only” 120 and 130 will more often go into the business world, where they may get rich.
3
See Chapter 19; Dunnette 1976; Ghiselli 1973.
4
Technically, a correlation coefficient is a ratio, with the covariation of the two variables in the numerator and the product of the separate standard deviations of the two variables in the denominator. The formula for computing a Pearson product moment correlation r (the kind that we will be using throughout) is: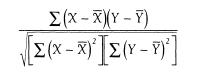 where X and Y refer to the actual values for each case and X and Y refer to the mean values of the X and Y, respectively.
5
We limited the sample to families making less than $100,000, so as to avoid some distracting technical issues that arise when analyzing income across the entire spectrum (e.g., the appropriateness of using logged values rather than raw values). The results from the 1 percent sample are in line with the statistics produced when the analysis is repeated for the entire national sample: a correlation of .31 and an increment of $2,700 per year of additional education. Income data are for 1989, expressed in 1990 dollars.
6
An important distinction: The underlying relationship persists in a sample with restricted range, but the restriction of range makes the relationship harder to identify (i.e., the correlation coefficient is attenuated, sometimes to near zero).
Forgetting about restriction of range produces fallacious reasoning that is remarkably common, even among academics who are presumably familiar with the problem. For example, psychologist David McClelland, writing at the height of the anti-IQ era in 1973, argued against any relationship between career success and IQ, pointing out that whereas college graduates got better jobs than nongraduates, the academic records of graduates did not correlate with job success, even though college grades correlate with IQ. He added, anecdotally, that he recalled his own college class—Wesleyan University, a top-rated small college—and was convinced that the eight best and eight worst students in his class had not done much differently in their subsequent careers (McClelland 1973). This kind of argument is also common in everyday life, as in the advice offered by friends during the course of writing this book. There was, for example, our friend the nuclear physicist, who prefaced his remarks by saying, “I don’t think I’m any smarter than the average nuclear physicist …” Or an engineer
friend, a key figure in the
Apollo
lunar landing program, who insisted that this IQ business is much overemphasized. He had been a C student in college and would not have even graduated, except that he managed to pull himself together in his senior year. His conclusion was that motivation was important, not IQ. Did he happen to know what his IQ was? Sure, he replied. It was 146. He was right, insofar as motivation can make the difference between being a first-rate rocket scientist and a mediocre one—if you start with an IQ of 146. But the population with a score of 146 (or above) represents something less than 0.2 percent of the population. Similarly, correlations of IQ and job success among college graduates suffer from restriction of range. The more selective the group is, the greater the restriction, which is why Derek Bok may plausibly (if not quite accurately) have claimed that SAT scores have “no correlation at all with what you do in the rest of your life” if he was talking about Harvard students.
7
E.g., Fallows 1985.
8
See Chapter 20 for more detail.
9
Griggs
v.
Duke Power,
401 U.S. 424 (1971).